คำอธิบาย
▁▂▃▄▅▆▇ █ เทรดเดอร์กว่า 10,000+ ราย (สถาบัน + รายย่อย) █ ▇▆▅▄▃▂▁
- เลือกตัวชี้วัด TOP ของเราใน cTrader 🏆
- ✨ ความแม่นยำพิเศษสำหรับผลลัพธ์ที่เหนือกว่า ✨
- 📈 อัลกอริทึมของเรา — พร้อมภาพที่ได้รับการจัดอันดับสูงสุด 🎯—
- ได้ถูกนำไปใช้สำเร็จในกองทุนควอนท์ 2 กองทุน
▁▂▃▄▅▆▇ █████████████████████████████ ▇▆▅▄▃▂▁
_______________________________________________
_______________________________________________
📌 ตัวชี้วัดโครงสร้างตลาด
· ✅ AdvancedMarket Structure: Bos, Choch, SwinLevels, Order Blocks, Market Structure& Liquidity Finder
· 🔄 Dynamic Market StructureAnalysis of Turning Points
· 🧱 Order Block
· ⚖️ Market Imbalance
· ⛓️ BOS & CHOCH
· 🧠 ICT Power of 3
______________________________________________________________-
เก็บ cBots : 🧠 Gold & BTC BreakoutSession Pivots 🧠
_______________________________________________
🔚 ระบบออกอัจฉริยะ
_______________________________________________
📐 ตัวชี้วัด ZigZag
· 🔍 ZigZag Price LiquidityProjection
· ➖ ZigZag
_______________________________________________
🧱 ตัวชี้วัดแนวรับ & แนวต้าน
· 🟩 SmartTrend Support &Resistance Lines
· 🧱 All Support and ResistanceLevels
_______________________________________________
📊 ตัวชี้วัดแนวโน้ม & ช่องทาง
· 📊 Supertrend
_______________________________________________
💧 เครื่องมือปริมาณ & สภาพคล่อง
_______________________________________________
⚡ ตัวชี้วัดโมเมนตัม & RSI
· 🔎 Multi-Level Candle BiasTracker
_______________________________________________
🔮 เครื่องมือทำนาย & การฉายภาพ
· 📐 Prediction Based on Linreg& ATR
· 📏 Fibonacci Linear RegressionMulti-timeframe
· 📈 Volume-Powered Market Flow Projector
______________________________________________________________________________________________________
เครื่องยนต์ความน่าจะเป็นของการกลับตัว 🔄
ตัวชี้วัดไฮบริดสำหรับตรวจจับโซนกลับตัว + การทำแผนที่หลายมิติของแนวรับและแนวต้าน "ระดับทอง" มันรวมการวิเคราะห์โครงสร้าง (จุดสูง/ต่ำของหน้าต่าง Fibonacci), พลวัต (ความเร็วและความเร่งของราคา), เอนโทรปี/ความวุ่นวาย (คำสั่งเทียบกับความไม่เป็นระเบียบ), โมเมนตัม และปริมาณ เพื่อสร้าง:
- ระดับแนวรับ/แนวต้านแบบลำดับชั้นตามระยะเวลาขอบฟ้า.
- สัญญาณความน่าจะเป็นของการกลับตัวที่เป็นไปได้ (ยอดและหุบเขา) พร้อมความมั่นใจเป็น % ⚠️
- โซนที่ใช้งาน (สี่เหลี่ยมผืนผ้า) เพื่อให้บริบทกับการเทรดและการตั้งจุดหยุด.
- กลุ่มการรวมตัว (เมื่อหลายกรอบเวลาตรงกันที่ราคาตัวเดียวกัน). 🎯
2. วัตถุประสงค์
ลดเสียงรบกวนทางสายตาและอำนวยความสะดวกในการตัดสินใจโดยการระบุ:
- ที่ที่ราคาถูกบีบอัดหรือยึดไว้ในหลายขอบฟ้า.
- ที่ที่ความน่าจะเป็นทางสถิติของการกลับตัวเพิ่มขึ้น (ได้รับการยืนยันหรือคาดการณ์). 📊
- ระดับใดที่มี "น้ำหนัก" มากที่สุด (การรวมตัว).
3. ตรรกะเชิงแนวคิด
a) ระดับ: สำหรับแต่ละหน้าต่าง Fibonacci จะนำจุดสูงสุด (R) และต่ำสุด (S) ล่าสุดมา; ซึ่งให้มาตราส่วนแบบแฟรคทัลของบริบท (ตั้งแต่สั้นมากถึงมหภาค).
b) การรวมกัน: ถ้าระดับที่แตกต่างกันหลายระดับอยู่ในระยะ X pips จะถูกรวมกลุ่ม → เป็นกลุ่มที่มีป้ายชื่อรวมและนับการรวมตัว.
c) สัญญาณกลับตัว: มองหารูปแบบการหมดแรงในท้องถิ่น (รูปแบบคลื่น), การชะลอตัว (การเปลี่ยนแปลงความชัน), การลดลงของเอนโทรปีต่ำ (เอนโทรปีต่ำ = การเคลื่อนไหวที่มีทิศทางมากขึ้นซึ่งมีแนวโน้มจะกลับตัว), ความเบี่ยงเบนภายในที่เป็นไปได้ และการยืนยันโมเมนตัม/ปริมาณ.
d) โหมดทำนาย: อนุญาตให้คาดการณ์การกลับตัว (รูปเพชร) ก่อนการยืนยันเต็มรูปแบบหากความเร่งตรงกันข้าม + เอนโทรปีต่ำ + สถานะสุดขีดสอดคล้องกัน. 💎
e) ความน่าจะเป็น: การถ่วงน้ำหนักแบบปกติของปัจจัยต่าง ๆ (แนวโน้ม, ความวุ่นวาย, โมเมนตัม, ปริมาณ, ความเบี่ยงเบน, การปรับตัว). ผลลัพธ์ถูกตัดทอนที่ 40–99%.
f) โซนที่ใช้งาน: หลังจากสัญญาณ จะมองหาช่วงที่สมเหตุสมผลที่สุด (ระหว่างระดับที่เกี่ยวข้อง) เพื่อจัดการการเทรดและให้บริบทกับจุดหยุด.
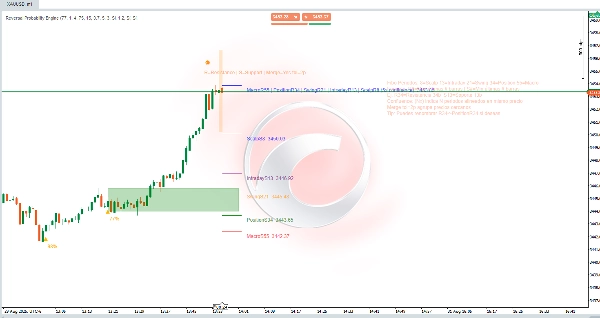
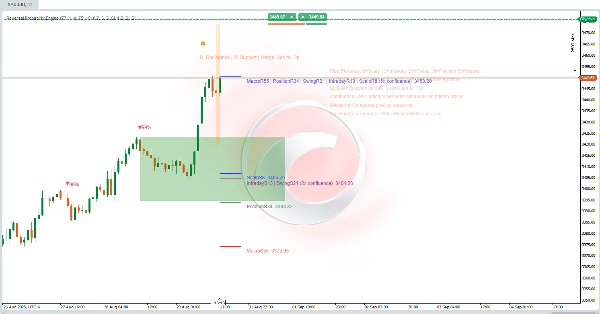
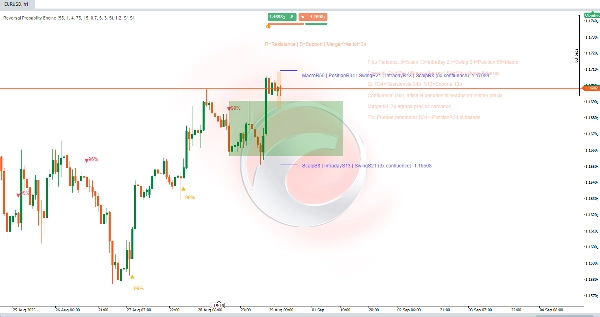
4. ส่วนประกอบทางสายตา
- เส้นแนวนอน: ระดับตามช่วงเวลา (Scalp 8, Intraday 13, Swing 21, Position 34, Macro 55). สีสม่ำเสมอต่อขอบฟ้า.
- ป้ายชื่อ R#/S#: R = แนวต้าน (จุดสูงสุดล่าสุดของหน้าต่างนั้น), S = แนวรับ (จุดต่ำสุดล่าสุด). ตัวอย่าง: R34 = แนวต้านที่ได้จาก 34 แท่งเทียนล่าสุด.
- ป้ายชื่อรวม:
ScalpS8 | IntradayS13 | … (5x confluence) Price. แสดงว่าช่วงเวลาที่แตกต่างกัน N ช่วงให้ระดับเดียวกัน (หรือภายในความทนทาน). ยิ่งมาก ยิ่งมีความเกี่ยวข้องมากขึ้น. ✅ - (Nx confluence): จำนวนช่วงเวลาที่ตรงกัน.
- ความทนทานในการรวม tol=Xp: ความทนทานในหน่วยพิปที่รวมระดับใกล้เคียงกัน (ป้องกันการอิ่มตัว).
- ความน่าจะเป็น (%): ข้อความเหนือ/ใต้สามเหลี่ยม (ลง / ขึ้น) หรือรูปเพชร (การตรวจจับล่วงหน้า).
- สี่เหลี่ยมสีเขียว (โซนที่ใช้งาน): ช่องทางปฏิบัติการแบบไดนามิกที่ประเมินการพัฒนาหลังสัญญาณ.
- บล็อก/สีเพิ่มเติมที่ละเอียดอ่อน: องค์ประกอบสนับสนุน (คลื่น/อนุภาค) หากเปิดใช้งาน.
5. การตีความเชิงปฏิบัติ
- การรวมตัวสูง (≥3x) = "แม่เหล็ก" หรือระดับจุดหมุนที่แข็งแกร่ง; คอยดูปฏิกิริยาของราคา. 🧲
- สัญญาณ + การรวมตัวใกล้เคียง เสริมความถูกต้อง (แต่ไม่รับประกัน).
- ความน่าจะเป็น ≥ % ความมั่นใจขั้นต่ำ: ตัวกรองขั้นต่ำเพื่อพิจารณาการดำเนินการ.
- แยกแยะระหว่าง คาดการณ์ (รูปเพชร) กับ ยืนยัน (สามเหลี่ยม): การคาดการณ์ให้ความเสี่ยง/ผลตอบแทนที่ดีกว่า อัตราความผิดพลาดสูงกว่า; ส่วนที่ได้รับการยืนยันมาพร้อมกับความไม่สมมาตรน้อยกว่าแต่มีการยืนยันมากขึ้น.
- สี่เหลี่ยม: ถ้าราคายังคงอยู่ภายในและไม่ทำให้ขอบตรงข้ามเป็นโมฆะ สมมติฐานยังคงมีชีวิตอยู่; การเบรกที่ชัดเจนลดความคาดหวัง.
- ขยายหรือลดความทนทานในการรวม: เล็ก = ความละเอียดสูงขึ้น, ใหญ่ = กลุ่มที่สังเคราะห์มากขึ้น.
6. กระบวนการใช้งาน
- โหลดตัวชี้วัดบนเครื่องมือและกรอบเวลาที่ต้องการ.
- ปรับ % ความมั่นใจขั้นต่ำตามความทนทาน (เช่น ต่ำสำหรับการสแคปปิ้ง สูงสำหรับสวิง).
- ตรวจสอบว่ามีกลุ่มแนวรับ/แนวต้านหลายชั้นปรากฏหรือไม่ (5x, 4x, ฯลฯ).
- รอสัญญาณ (เหมาะถ้าเกิดที่ขอบของกลุ่มและมีความน่าจะเป็นสูง). 🔔
- กำหนดขอบเขตการจัดการภายในโซนที่ใช้งาน: การเข้าซื้อแบบสเต็กเกอร์หรือการยืนยันการเบรกเอาท์ที่ล้มเหลว.
- กำหนดจุดหยุดที่สมเหตุสมผล: เกินระดับต่ำสุด (ในตำแหน่งยาว) หรือตำแหน่งสูงสุด (ในตำแหน่งสั้น) แรกที่ไม่อยู่ในกลุ่มรวม.
- ปิดการใช้งานช่วงเวลาที่คุณไม่ใช้ (เช่น ใช้เฉพาะ Swing/Macro สำหรับตำแหน่งยาว).
- ปรับความทนทานและถ้าต้องการ ซ่อนแผงคำอธิบายหลังจากเรียนรู้แล้ว.
7. ตัวอย่างการอ่านป้ายชื่ออย่างรวดเร็ว
ScalpS8 | IntradayS13 | SwingS21 | PositionS34 | MacroS55 (5x confluence)
ความหมาย: ทุกกรอบเวลา (8–55) มีระดับเดียวกัน → แนวรับโครงสร้างหลายระดับ. ความน่าจะเป็นของปฏิกิริยาสูง; หากสูญเสียพร้อมปริมาณ หมายถึงการเปลี่ยนแปลงระบอบที่รุนแรงขึ้น. 🚨
สรุป
Key features include:
- Hierarchical support and resistance levels categorized by time horizons (from ultra-short scalp to macro scales).
- Probabilistic reversal signals indicating potential peaks and valleys with confidence percentages.
- Active zones displayed as rectangles to help contextualize trade entries and stop placements.
- Confluence clusters that highlight price levels confirmed across multiple timeframes, enhancing level significance.
The indicator reduces visual noise by grouping nearby levels within a tolerance range and provides clear visual components such as horizontal lines, labeled resistance/support points, merged confluence labels, probability percentages, and active zones. It distinguishes between anticipated and confirmed reversal signals, offering traders options for risk management and trade timing.
Users can adjust confidence thresholds and merge tolerances to tailor granularity and filtering according to their trading style and timeframe. The tool supports structured decision-making by identifying statistically significant reversal areas and multi-scale support/resistance clusters on any instrument and timeframe.
รีวิวจากลูกค้า
5 | 0 % | |
4 | 0 % | |
3 | 0 % | |
2 | 0 % | |
1 | 100 % |