
คำอธิบาย
ระบบ Adaptive Trailing 🚀
ระบบ Adaptive Trailing เป็น trailing stop แบบปรับตัวขั้นสูงที่ใช้ ความผันผวนที่ถูกทำให้เป็นปกติแบบลอการิทึม เพื่อปรับระดับการปกป้องกำไรโดยอัตโนมัติ 📊 แตกต่างจาก trailing stop แบบดั้งเดิมที่มีระยะคงที่ ระบบนี้คำนวณระยะแบบไดนามิกตามความผันผวนจริงของตลาด ปรับตัวอย่างต่อเนื่องตามสภาพที่เปลี่ยนแปลง 🔄
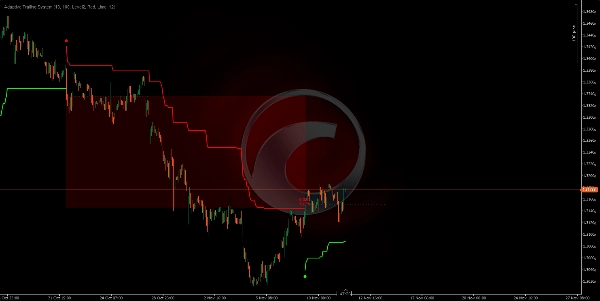
Spotware GBPUSD 691360763c684 | cTrader
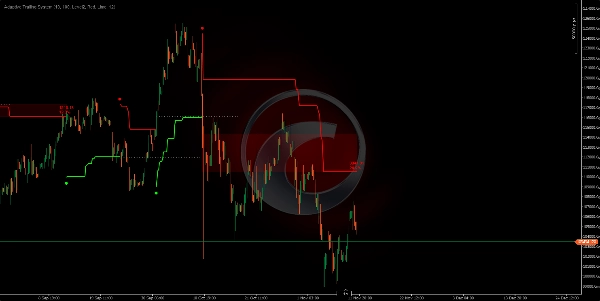
Spotware XAUUSD 691360adf1386 | cTrader
Spotware XAUUSD 691360adf1386 | cTrader
อัลกอริทึม Adaptive Trailing ที่ไม่เหมือนใคร ⚙️
ระบบใช้ วิธีทางสถิติ ที่ไม่เคยสร้างระยะ trailing เดิมซ้ำ:
• คำนวณ True Range ของราคาในช่วงเวลาที่กำหนดได้.
• ใช้ การแปลงลอการิทึม กับค่าพวกนี้เพื่อทำให้การแจกแจงเป็นปกติ.
• คำนวณ ค่าเฉลี่ยและส่วนเบี่ยงเบนมาตรฐาน ของค่าลอการิทึมเหล่านี้.
• สร้าง ระยะ offset เฉพาะตัว ตามระดับความผันผวน (0, 1, 2 หรือ 3 ส่วนเบี่ยงเบนมาตรฐาน). 🎯
• trailing stop จะถูกปรับอย่างต่อเนื่องโดยใช้ ราคาทั่วไป (ค่าเฉลี่ยของ High, Low, Close).
ผลลัพธ์: ทุกช่วงเวลาตลาดมีระยะ trailing ของตัวเอง คำนวณตามความผันผวนเฉพาะของบริบทนั้น 🤖
พื้นฐานทางเทคนิค: ความผันผวนที่ถูกทำให้เป็นปกติแบบลอการิทึม 🧠
ทำไมต้องแปลงลอการิทึม? 🤔
ความผันผวนของตลาดไม่ได้เป็นไปตามการแจกแจงแบบปกติ (Gaussian) มักมีค่าผิดปกติสูง การแปลงลอการิทึม:
- ทำให้การแจกแจงเป็นปกติ: แปลงข้อมูลที่เอียงให้เป็นการแจกแจงที่สมมาตรมากขึ้น.
- ทำให้ความแปรปรวนคงที่: ลดผลกระทบจากความผันผวนที่สูงผิดปกติ.
- ช่วยให้เปรียบเทียบทางสถิติได้: ทำให้สามารถใช้ส่วนเบี่ยงเบนมาตรฐานได้อย่างมีความหมาย.
กระบวนการคำนวณ Offset 🔢
- ช่วงเวลาของ True Range: วัดช่วงสูงสุดโดยพิจารณา High-Low ของช่วงเวลาและช่องว่างกับราคาปิดก่อนหน้า.
- ลอการิทึมธรรมชาติ: ใช้
ln(True Range)เพื่อทำให้เป็นปกติ. - หน้าต่างการทำให้เป็นปกติ: เก็บค่าลอการิทึมล่าสุด N ค่า (ช่วงเวลาการทำให้เป็นปกติ).
- ค่าเฉลี่ยลอการิทึม: ค่าเฉลี่ยของทุก
ln(TR)ในหน้าต่าง. - ส่วนเบี่ยงเบนมาตรฐาน: คำนวณการกระจายของค่าลอการิทึม.
- ระดับความผันผวน: คูณส่วนเบี่ยงเบนด้วย 0, 1, 2 หรือ 3 ตามการตั้งค่า.
- Offset สุดท้าย:
Offset = e^(mean + level × deviation)- แปลงกลับเป็นสเกลราคา 💡
มันทำงานอย่างไร? ⚡
กลไก Trailing แบบสองทิศทาง
ระบบทำงานในสองโหมดสลับกัน:
โหมด BEARISH (Short): 📉
• วาง trailing stop เหนือ ราคาปัจจุบัน.
• ปรับปรุง ลง เมื่อราคาลดลง (ไม่เคยเพิ่มขึ้น).
• สัญญาณกลับตัว เมื่อราคาปิด เหนือ trailing stop.
โหมด BULLISH (Long): 📈
• วาง trailing stop ใต้ ราคาปัจจุบัน.
• ปรับปรุง ขึ้น เมื่อราคาเพิ่มขึ้น (ไม่เคยลดลง).
• สัญญาณกลับตัว เมื่อราคาปิด ต่ำกว่า trailing stop.
สัญญาณกลับตัว:
• จุดวงกลมแสดงถึง การเปลี่ยนแปลงแนวโน้ม (การเข้าตำแหน่งใหม่).
• สีเขียว = แนวโน้ม ขาขึ้นใหม่ (). ✅
• สีแดง = แนวโน้ม ขาลงใหม่ (). 🔴
พารามิเตอร์และผลกระทบ 🎛️
ช่วงเวลาคำนวณ (10)
- ฟังก์ชัน: กำหนดจำนวนแท่งที่ใช้คำนวณ True Range.
- ↑ สูงกว่า (20-50): วัดความผันผวนระยะยาวมากขึ้น เรียบเนียนและไวต่อการเปลี่ยนแปลงน้อยลง.
- ↓ ต่ำกว่า (5-8): วัดความผันผวนระยะสั้น ตอบสนองเร็ว ตรวจจับการเปลี่ยนแปลงอย่างรวดเร็ว.
ช่วงเวลาการทำให้เป็นปกติ (100)
- ฟังก์ชัน: หน้าต่างของค่าลอการิทึมเพื่อคำนวณค่าเฉลี่ยและส่วนเบี่ยงเบนมาตรฐาน.
- ↑ สูงกว่า (200-500): การทำให้เป็นปกติที่เสถียรมากขึ้น การเปลี่ยนแปลง offset เป็นไปอย่างค่อยเป็นค่อยไป.
- ↓ ต่ำกว่า (50-80): การทำให้เป็นปกติที่ตอบสนองเร็วขึ้น offset ปรับตัวเร็วขึ้น.
- ผลกระทบสำคัญ: พารามิเตอร์นี้กำหนดว่าบริบทความผันผวนในอดีตถูก "จดจำ" ไว้มากน้อยเพียงใด 🧠
ระดับความผันผวน (ระดับ 2)
- ฟังก์ชัน: จำนวนส่วนเบี่ยงเบนมาตรฐานที่ใช้ในการคำนวณ offset.
- ระดับ 0 (0σ): Offset = ค่าเฉลี่ยลอการิทึม = ระยะที่แคบที่สุด ความไวสูงสุด 🎯
- ระดับ 1 (1σ): Offset รวม 1 ส่วนเบี่ยงเบน = ระยะปานกลาง จับการเปลี่ยนแปลงประมาณ 68%.
- ระดับ 2 (2σ): Offset รวม 2 ส่วนเบี่ยงเบน = ระยะกว้างขึ้น จับการเปลี่ยนแปลงประมาณ 95% (สมดุล). ⚖️
- ระดับ 3 (3σ): Offset รวม 3 ส่วนเบี่ยงเบน = ระยะกว้างมาก จับการเปลี่ยนแปลงประมาณ 99% ความทนทานสูงสุด 🛡️
___________________________________________________________________________________________________
🚀 เทรดเดอร์กว่า 10,000 คนใช้ อินดิเคเตอร์ของเราที่ดีที่สุด 🏆
👉 รับระบบ TOP ทั้งหมดของเราได้ที่นี่:
_______________________________________________
📌 อินดิเคเตอร์โครงสร้างตลาด
· ✅ AdvancedMarket Structure: Bos, Choch, SwinLevels, Order Blocks, Market Structure& Liquidity Finder
· 🔄 Dynamic Market StructureAnalysis of Turning Points
· 🧱 Order Block
· ⚖️ Market Imbalance
· ⛓️ BOS & CHOCH
· 🧠 ICT Power of 3
_______________________________________________
🔚 ระบบ Smart Exit
_______________________________________________
📐 อินดิเคเตอร์ ZigZag
· 🔍 ZigZag Price LiquidityProjection
· ➖ ZigZag
_______________________________________________
🧱 อินดิเคเตอร์แนวรับและแนวต้าน
· 🟩 SmartTrend Support &Resistance Lines
· 🧱 All Support and ResistanceLevels
_______________________________________________
📊 อินดิเคเตอร์แนวโน้มและช่องทาง
· 📊 Supertrend
_______________________________________________
💧 เครื่องมือปริมาณและสภาพคล่อง
_______________________________________________
⚡ อินดิเคเตอร์ Momentum & RSI
· 🔎 Multi-Level Candle Bias
Tracker
_______________________________________________
🔮 เครื่องมือทำนายและพยากรณ์
· 📐 Prediction Based on Linreg& ATR
· 📏 Fibonacci Linear RegressionMulti-timeframe
· 📈 Volume-Powered Market Flow Projector_________________________________________________________________________________________________
สรุป
The system operates bidirectionally with two modes:
- Bearish (short) mode places the trailing stop above the price, adjusting downward as price falls, signaling a reversal when price closes above the stop.
- Bullish (long) mode places the trailing stop below the price, adjusting upward as price rises, signaling a reversal when price closes below the stop.
Reversal signals are visually marked with colored dots indicating trend changes (green for bullish, red for bearish). Key parameters include the calculation period for True Range, normalization period for volatility data, and volatility level defining the offset distance based on standard deviations.
This indicator supports various markets including Forex, cryptocurrencies, commodities, indices, and stocks, with symbols such as BTCUSD, EURUSD, GBPUSD, XAUUSD, NAS100, and USDJPY. It is designed to provide adaptive trailing stops that respond to real-time volatility, enhancing trade exit strategies.


