
说明
自适应追踪系统 🚀
自适应追踪系统是一种先进的自适应追踪止损,使用 对数归一化波动率 自动调整利润保护水平。📊 与传统的固定距离追踪止损不同,该系统根据市场的实际波动率计算动态距离,持续适应变化的市场条件。🔄
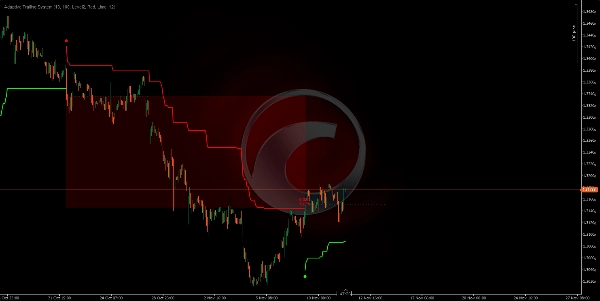
Spotware GBPUSD 691360763c684 | cTrader
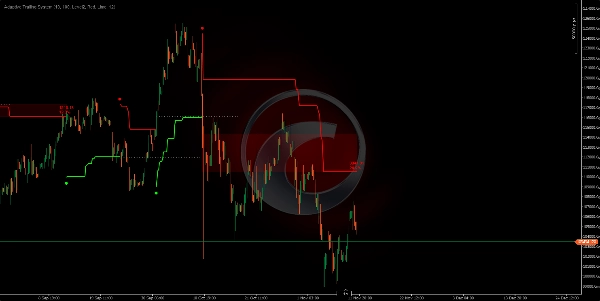
Spotware XAUUSD 691360adf1386 | cTrader
Spotware XAUUSD 691360adf1386 | cTrader
独特的自适应追踪算法 ⚙️
该系统使用一种 统计方法 永远不会生成相同的追踪距离:
• 计算一段可配置周期内价格的 真实波幅。
• 对这些数值应用 对数变换 以归一化分布。
• 计算这些对数值的 均值和标准差。
• 根据波动率水平(0、1、2或3个标准差)生成 唯一的偏移距离。🎯
• 使用 典型价格(高、低、收盘价的平均值)持续调整追踪止损。
结果: 每个市场时刻都有其特定的追踪距离,根据该环境的具体波动率计算。🤖
技术基础:对数归一化波动率 🧠
为什么使用对数变换? 🤔
市场波动率不遵循正态(高斯)分布;它倾向于出现极端值。对数变换:
- 归一化分布: 将偏斜数据转换为更对称的分布。
- 稳定方差: 减少极端波动峰值的影响。
- 实现统计比较: 使得标准差的使用更有意义。
偏移计算过程 🔢
- 周期真实波幅: 测量最大范围,考虑该周期的高低价及与前收盘价的跳空。
- 自然对数: 应用
ln(True Range)进行归一化。 - 归一化窗口: 保持最近N个对数值(归一化周期)。
- 对数均值: 窗口内所有
ln(TR)值的平均。 - 标准差: 计算对数值的离散程度。
- 波动率级别: 根据配置,将偏差乘以0、1、2或3。
- 最终偏移:
Offset = e^(mean + level × deviation)- 转换回价格尺度。💡
它是如何工作的?⚡
双向追踪机制
系统在两种交替模式下运行:
看跌模式(空头): 📉
• 追踪止损设置在价格的 上方。
• 当价格下跌时向 下方更新(绝不向上)。
• 当价格 收盘价 高于追踪止损时,发出 反转信号。
看涨模式(多头): 📈
• 追踪止损设置在价格的 下方。
• 当价格上涨时向 上方更新(绝不向下)。
• 当价格 收盘价 低于追踪止损时,发出 反转信号。
反转信号:
• 一个圆点标记了 趋势变化 (新仓位的进入)。
• 绿色 = 新的 看涨 趋势()。✅
• 红色 = 新的 看跌 趋势()。🔴
参数及影响 🎛️
计算周期(10)
- 功能: 定义用于计算真实波幅的柱数。
- ↑ 较高(20-50): 衡量长期波动,平滑且不敏感。
- ↓ 较低(5-8): 衡量短期波动,更加敏感,能检测快速变化。
归一化周期(100)
- 功能: 用于计算均值和标准差的对数值窗口。
- ↑ 较高(200-500): 归一化更稳定,偏移变化缓慢。
- ↓ 较低(50-80): 归一化更敏感,偏移适应更快。
- 关键影响: 该参数决定历史波动环境的“记忆”程度。🧠
波动率级别(级别 2)
- 功能: 应用于偏移计算的标准差数量。
- 级别 0 (0σ): 偏移=对数均值=最紧距离,最大灵敏度。🎯
- 级别 1 (1σ): 偏移包含1个偏差=中等距离,捕捉约68%的变化。
- 级别 2 (2σ): 偏移包含2个偏差=较宽距离,捕捉约95%的变化(平衡)。⚖️
- 级别 3 (3σ): 偏移包含3个偏差=非常宽距离,捕捉约99%的变化,最大容忍度。🛡️
___________________________________________________________________________________________________
🚀 超过10,000名交易者已使用我们的顶级 指标🏆
👉 在这里获取我们所有的顶级系统:
_______________________________________________
📌 市场结构指标
· ✅ AdvancedMarket Structure: Bos, Choch, SwinLevels, Order Blocks, Market Structure& Liquidity Finder
· 🔄 Dynamic Market StructureAnalysis of Turning Points
· 🧱 Order Block
· ⚖️ Market Imbalance
· ⛓️ BOS & CHOCH
· 🧠 ICT Power of 3
_______________________________________________
🔚 智能退出系统
· 📍 追踪智能算法
_______________________________________________
📐 之字形指标
· 🔍 ZigZag 价格流动性投影
· 🧭 支撑阻力结构之字形
· ➖ 之字形
· 🎯 之字形极端追踪器
_______________________________________________
🧱 支撑与阻力指标
· 🟩 智能趋势支撑与阻力线
· 🧱 所有支撑与阻力水平
_______________________________________________
📊 趋势与通道指标
· 🔄 自动趋势通道
· 📊 超级趋势
· ⚡动量趋势分析器
· 🧠 自适应趋势通道
· 💥 通道突破系统
· 🌈 动态趋势梯度
· ⭐ 高级SSL通道
· 🔁 反应性移动平均线
_______________________________________________
💧 成交量与流动性工具
· 🔥 成交量POC热力图
· 📉 杠杆清算图
· 🔍 动量公平价值缺口
· 🕒 公平价值缺口时段
_______________________________________________
⚡ 动量与RSI指标
· 📈 RSI趋势触发器
· 🚀 动态范围动量
· 🔎 多级蜡烛偏向
追踪器
_______________________________________________
🔮 预测与投影工具
· 📐 基于线性回归与ATR的预测
· 📏 斐波那契线性回归多时间框架
· 📈 成交量驱动的市场流动投影器_________________________________________________________________________________________________
摘要
The system operates bidirectionally with two modes:
- Bearish (short) mode places the trailing stop above the price, adjusting downward as price falls, signaling a reversal when price closes above the stop.
- Bullish (long) mode places the trailing stop below the price, adjusting upward as price rises, signaling a reversal when price closes below the stop.
Reversal signals are visually marked with colored dots indicating trend changes (green for bullish, red for bearish). Key parameters include the calculation period for True Range, normalization period for volatility data, and volatility level defining the offset distance based on standard deviations.
This indicator supports various markets including Forex, cryptocurrencies, commodities, indices, and stocks, with symbols such as BTCUSD, EURUSD, GBPUSD, XAUUSD, NAS100, and USDJPY. It is designed to provide adaptive trailing stops that respond to real-time volatility, enhancing trade exit strategies.


