
Deskripsi
🔥 Pinescritlabs
Indikator Toko Ctrader: 🤖Pinescritlabs Ctrader Store cBots:
Fair Value Gap Sessions Gold & BTC Breakout Session Pivots
Dynamic Market Structure
Analisis Titik Balik
Fibonacci Linear
Regresi Multi-timeframe
Multi-Level Candle Bias
Tracker
Auto Support and
Resistance Trend Lines
All Support and
Resistance Levels
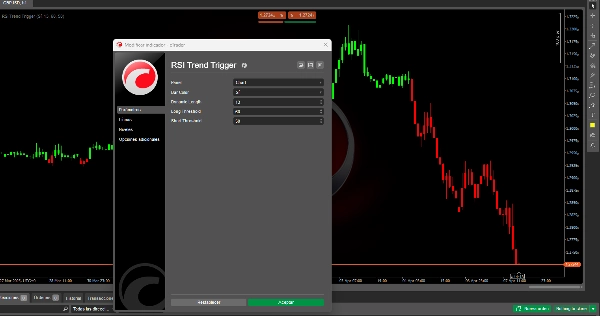
RSI Trend Trigger 📈✨
Bagaimana Cara Kerjanya? 🤔
Langkah 1: RSI Tradisional
Indeks Kekuatan Relatif (Relative Strength Index (RSI)) standar dihitung, mengukur kecepatan dan besarnya pergerakan harga selama periode tertentu. Nilainya berosilasi antara 0 dan 100, mengidentifikasi kondisi jenuh beli (misalnya, di atas 70) dan jenuh jual (misalnya, di bawah 30). 📊📉📈
Langkah 2: Penyempurnaan Dinamis
RSI tradisional menjalani proses penghalusan lanjutan:
- Perhitungan matematis kedua diterapkan pada nilai RSI asli (bukan harga itu sendiri).
- Langkah ini menciptakan versi RSI yang lebih stabil, mengurangi fluktuasi kecil (noise pasar) dan menyoroti tren yang sebenarnya.
- Berbeda dengan penghalusan dasar, metode ini mempertahankan responsivitas terhadap perubahan momentum signifikan, menghindari keterlambatan berlebihan. 🛡️🔄
Mengapa Penyempurnaan Ini Penting? 🤩
- Penyaringan Cerdas: Menghilangkan sinyal palsu yang disebabkan oleh volatilitas sementara, seperti lonjakan berita atau pergerakan spekulatif. �🗑️
- Tren Lebih Tajam: Pendekatan perhitungan ganda membedakan antara koreksi kecil dan pembalikan tren nyata. 🎯
- Sinyal Persisten: Setelah tren (bullish/bearish) dikonfirmasi, indikator mempertahankannya sampai terjadi pembalikan yang jelas, menghindari lonjakan sinyal yang tidak stabil. 🔒
Penggunaan Praktis: Ambang Batas & Pengambilan Keputusan 📈
RSI yang disempurnakan digabungkan dengan dua ambang batas yang dapat disesuaikan:
- Ambang Batas Bullish (misalnya, 60):
-
- Jika RSI yang disempurnakan melewati level ini ke atas, tren bullish dikonfirmasi. 🚀
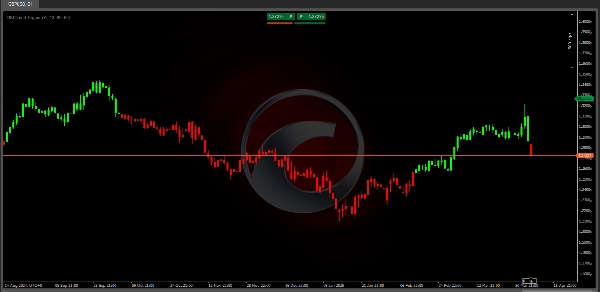
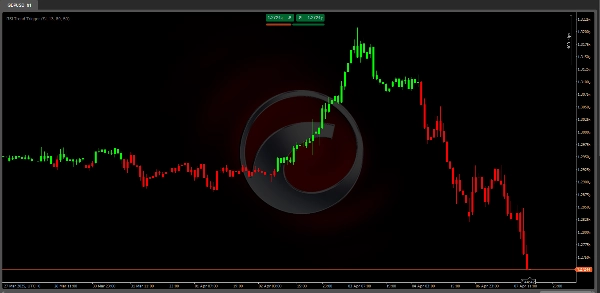
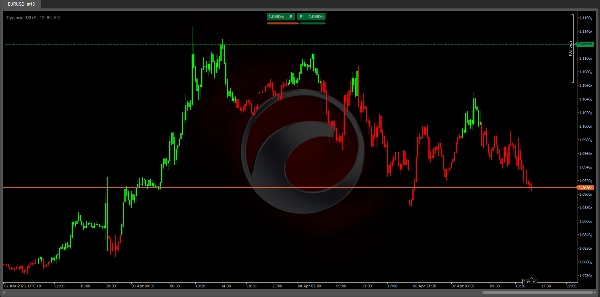
- Lilin berubah menjadi hijau
- Ambang Batas Bearish (misalnya, 50):
-
- Jika RSI yang disempurnakan turun di bawah level ini, tren bearish dipicu. 📉
- Lilin berubah menjadi merah
Aturan Utama:
- Sinyal hanya muncul selama perubahan tren (tidak pada setiap fluktuasi), mengurangi kelebihan informasi. 🚫📢
- Ambang batas dapat disesuaikan: gunakan nilai lebih tinggi (misalnya, 65/55) untuk pasar yang volatil atau nilai lebih rendah (misalnya, 55/45) untuk tren yang lebih halus. ⚙️
Manfaat untuk Trader 🏆
- Presisi yang Ditingkatkan:
-
- Lebih sedikit sinyal palsu berkat penyaringan lapisan ganda. Ideal untuk pasar sideways atau fakeout. ✅
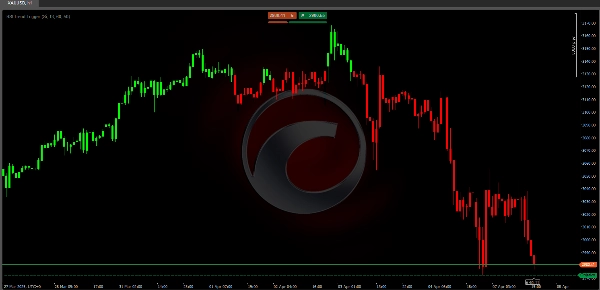
- Visualisasi Intuitif:
-
- Lilin berwarna dan ambang batas visual memungkinkan Anda melihat tren secara instan. 👀🎨
- Adaptabilitas:
-
- Bekerja di berbagai aset (forex, saham, kripto) dan kerangka waktu (menit hingga minggu). 🌍⏳
- Perdagangan Berfokus pada Tren:
-
- Membantu berdagang dengan momentum, menghindari pergerakan melawan tren yang berisiko. 🎯🚦
Contoh Alur Sinyal
Bayangkan RSI yang disempurnakan berada di 55 (zona netral):
- Skenario Bullish: Naik ke 62 → Melintasi ambang batas 60 → Lilin berubah hijau🚀
- Skenario Bearish: Turun ke 48 → Menembus ambang batas 50 → Lilin berubah merah📉
Ringkasan
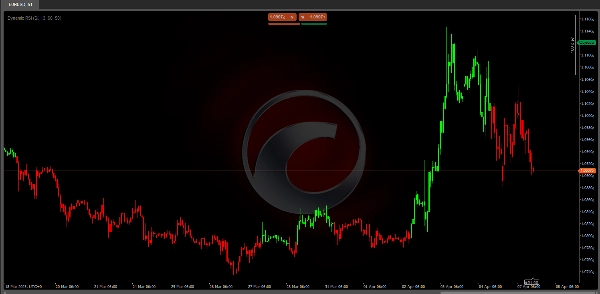
The indicator then applies an advanced smoothing process to the RSI values, not the price data, creating a refined RSI that reduces minor market noise while maintaining sensitivity to significant momentum changes. This dual-layer calculation enhances signal precision by filtering out false signals caused by temporary volatility and distinguishing between minor corrections and genuine trend reversals.
Users can customize two threshold levels—a bullish threshold (e.g., 60) and a bearish threshold (e.g., 50)—to define when a trend is confirmed. When the refined RSI crosses above the bullish threshold, the indicator signals a bullish trend with green candles; when it falls below the bearish threshold, it signals a bearish trend with red candles. Signals appear only during trend changes, reducing information overload.
The RSI Trend Trigger supports multiple timeframes from minutes to weeks and is adaptable to different market conditions, aiding traders in aligning with momentum and avoiding counter-trend risks.
Ulasan pelanggan
5 | 67 % | |
4 | 33 % | |
3 | 0 % | |
2 | 0 % | |
1 | 0 % |


