
Descrizione
📈 Media Mobile del Segnale 📉
La Media Mobile del Segnale è un indicatore che combina una Media Mobile Semplice (SMA) con un calcolo dinamico della correlazione per adattarsi meglio alle condizioni di mercato. 🎯 Questo indicatore regola la sua sensibilità in base alla forza del trend, rendendolo uno strumento potente per identificare i trend e filtrare il rumore di mercato. 🌟
Caratteristiche Principali 🔑
📊 Media Mobile Regolata:
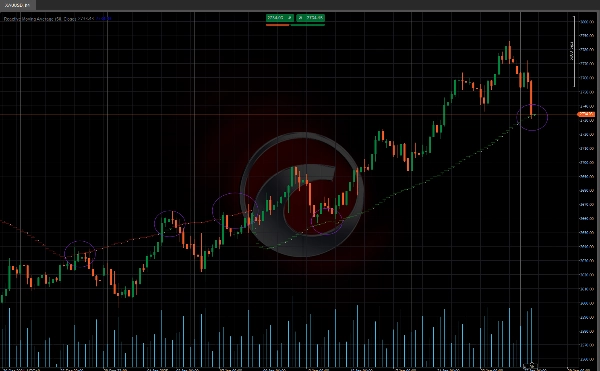
- La linea della media mobile si regola dinamicamente in base alla correlazione tra prezzo e tempo.
- Nei mercati con trend forti, la media mobile si muove più velocemente per seguire il prezzo. 🚀
- Nei mercati laterali, la media mobile rimane più stabile, riducendo i falsi segnali. 🛑
🔢 Calcolo della Correlazione:
- L'indicatore calcola la correlazione tra prezzo e tempo usando la formula di Pearson.
- Regola la media mobile basandosi sul coefficiente di determinazione (R²). 🧮
👀 Visualizzazione:
- Visualizzazione chiara e intuitiva per una facile interpretazione. 📉📈
Come Usare l'Indicatore 🛠️
🔍 Identificazione del Trend:
- Trend Rialzista: Quando il prezzo è sopra la media mobile correlata. 🐂
- Trend Ribassista: Quando il prezzo è sotto la media mobile correlata. 🐻
✅ Conferma del Segnale:
- Usa la media mobile regolata come livello dinamico di supporto o resistenza. 🛡️
- Combina questo indicatore con altri strumenti tecnici per confermare i segnali. 🔄
Regolazione della Media Mobile ⚙️
L'algoritmo regola la media mobile in base al valore di R²:
- Se R² > 0.5 (correlazione significativa):
-
- La media mobile viene regolata usando una combinazione ponderata tra il valore attuale della SMA e il valore precedente della media mobile regolata (_ma).
- La ponderazione dipende dal valore di R². ⚖️
- Se R² ≤ 0.5 (correlazione non significativa):
-
- La media mobile viene regolata sottraendo un valore proporzionale alla differenza assoluta tra il valore attuale della SMA e il valore precedente della media mobile regolata. 🔄
- Indicatori del Ctrader Store:
Dynamic Market Structure
Analysis of Turning Points
Fibonacci Linear
Regression Multi-timeframe
Multi-Level Candle Bias
Tracker
Auto Support and
Resistance Trend Lines
Riepilogo
Key functionalities include:
- **Adjusted Moving Average**: The moving average line dynamically adapts according to the correlation between price and time. It accelerates in strong trending markets to closely follow price movements and stabilizes in sideways markets to minimize false signals.
- **Correlation Calculation**: Utilizes the Pearson formula to compute the correlation between price and time, adjusting the moving average based on the coefficient of determination (R²).
- **Moving Average Adjustment**: When R² is greater than 0.5, the moving average is updated using a weighted combination of the current SMA and the previous adjusted value, with weights depending on R². For R² less than or equal to 0.5, adjustments are made by subtracting a value proportional to the difference between the current SMA and prior adjusted average.
- **Visualization**: Provides a clear and intuitive display for easy interpretation.
Usage involves identifying bullish trends when price is above the adjusted moving average and bearish trends when below. The indicator can also serve as a dynamic support or resistance level and be combined with other technical tools for signal confirmation.
Recensioni dei clienti
5 | 100 % | |
4 | 0 % | |
3 | 0 % | |
2 | 0 % | |
1 | 0 % |


![Logo di "Smart Money Concepts (SMC) [Iridio Capital]"](https://cdn.ctrader.com/image/webp/28b69fd1-ef54-4bed-9487-07e78e883be4_40934)
