
Breakout Pattern Indicators for cTrader
Compare breakout pattern indicators for cTrader that help detect consolidation breaks and volatility expansion. These forex tools support traders watching ranges, channels, triangles and key levels before momentum-based entries.
Tools
Tool comparison
FAQ





















Tool comparison
Product | Reviews | Downloads | Sales | Price | Compatible platforms |
|---|---|---|---|---|---|
Pivot Breakout Detector | — | 782 | — | Free | Windows, Mac |
Samurai Breakout Pro II | 5.0 (4) | — | 25 | $69 | Windows, Mac |
BOS CHOCH PRO 3.0 | 4.5 (2) | 745 | — | Free | Windows, Mac |
Smart Money Breakout Channels | 5.0 (3) | — | 11 | $49 | Windows, Mac |
Free_ICT Breakers_BOS_MSS_withSourceCode | 5.0 (2) | 738 | — | Free | Windows, Mac |
LT_SmartSwings | 5.0 (2) | — | 7 | $19 | Windows, Mac |
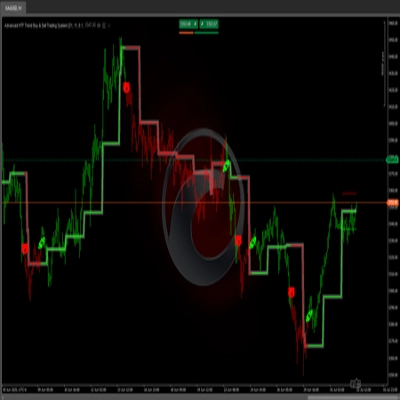
Advanced HTF Trend Buy & Sell Trading System | — | 715 | — | Free | Windows, Mac |
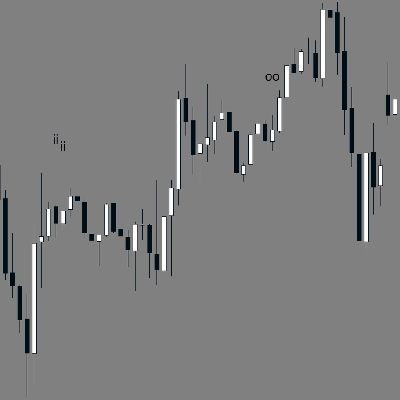
[Stellar Strategies] Inside Bar with Signals | 5.0 (3) | — | 5 | $19 | Windows, Mac |
[Stellar Strategies] Market Structure Breakout | 5.0 (1) | 705 | — | Free | Windows, Mac |
CHOCH BREAKOUT BLOCK | 4.7 (6) | — | 4 | $19 | Windows, Mac |
Breakout channel | — | 629 | — | Free | Windows, Mac |
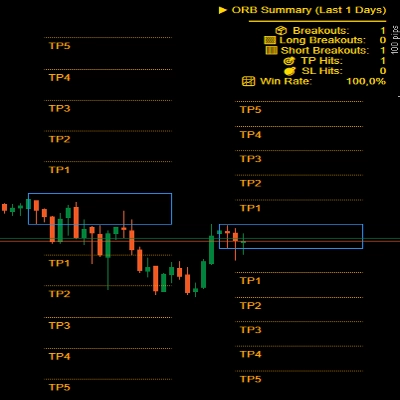
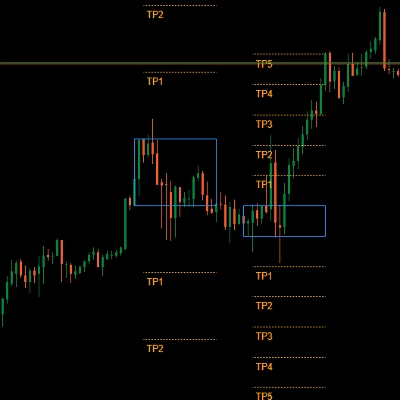
ORB v1.1 | 4.0 (4) | — | 4 | $25 | Windows, Mac |
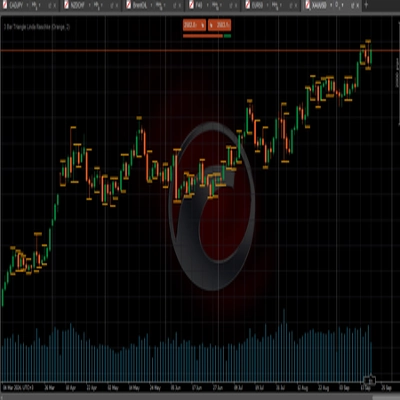
3 Bar Triangle by Linda Raschke | 5.0 (1) | 572 | — | Free | Windows, Mac |
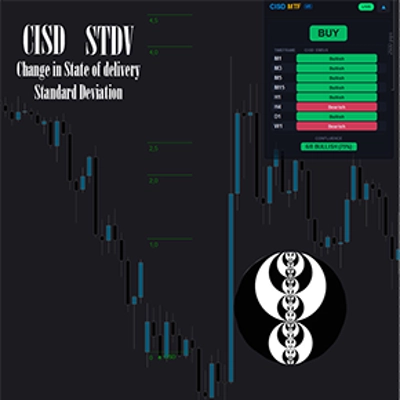
CISD with STDV ICT | 4.5 (4) | — | 3 | from $15 | Windows, Mac |
MeetAlgo_ChannelTrading_cTrader | 5.0 (3) | 447 | — | Free | Windows, Mac |
ORB_Dashboard | 4.6 (7) | — | 3 | $25 | Windows, Mac |
WeTrade Trendline Breakout | 5.0 (1) | 441 | — | Free | Windows, Mac |
ORB v1 | 5.0 (3) | — | 3 | $19 | Windows, Mac |
Breakout Mode Patterns | — | 439 | — | Free | Windows, Mac |
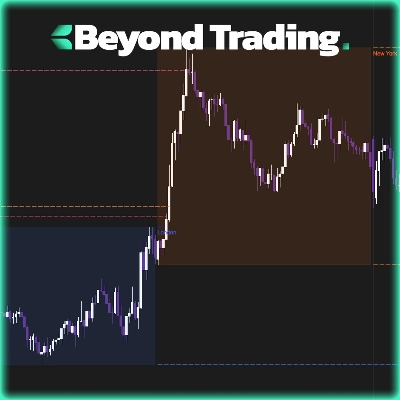
Sessions | 5.0 (4) | — | 3 | $19 | Windows, Mac |
Smart Trend Scanner | — | 417 | — | Free | Windows, Mac |
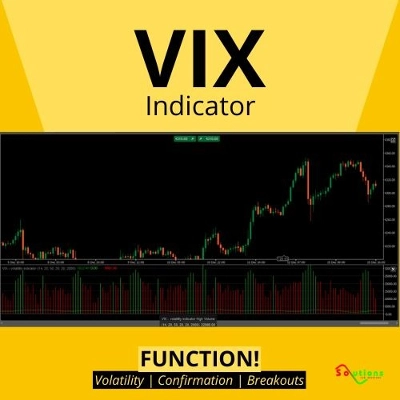
VIX - volatility indicator | 4.7 (3) | — | 2 | $25 | Windows, Mac |
Trend Bias Structure | 5.0 (1) | 352 | — | Free | Windows, Mac |
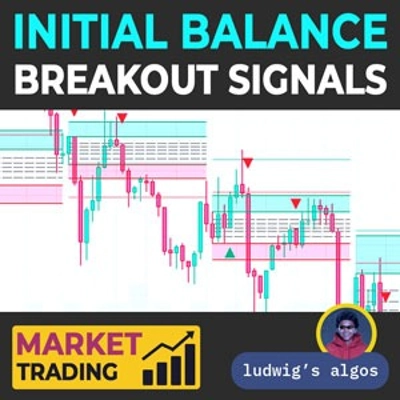
Initial Balance Breakout Signals | 5.0 (2) | — | 2 | $49 | Windows, Mac |
Smart SR Levels | — | 351 | — | Free | Windows, Mac |
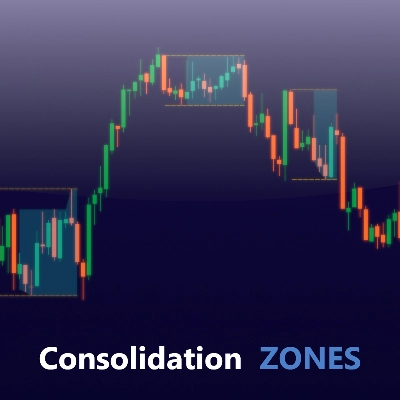
Consolidation Zones | 4.3 (3) | — | 2 | $19 | Windows, Mac |
Samurai Breakout Lite | — | 332 | — | Free | Windows, Mac |
Impulse Matrix Pro | 5.0 (3) | — | 2 | $25 | Windows, Mac |
Volatility Regime ALMA | 5.0 (3) | 271 | — | Free | Windows, Mac |
Bollinger Bands Breakout Oscillator (+ Alerts) | 4.5 (4) | — | 2 | $19 | Windows, Mac |
ORB SMA | 4.0 (1) | 268 | — | Free | Windows, Mac |
ORB_BRSTrading | 4.7 (3) | — | 1 | $40 | Windows, Mac |
We Smart Breakout Retest | — | 242 | — | Free | Windows, Mac |
HTFBB | 4.5 (2) | — | 1 | $19 | Windows, Mac |
Dynamic Trendline Indicator-cBot | — | 220 | — | Free | Windows, Mac |
wt.Z-Trend | 4.5 (4) | — | 1 | $19 | Windows, Mac |
ScalperSignalVisual | — | 219 | — | Free | Windows, Mac |
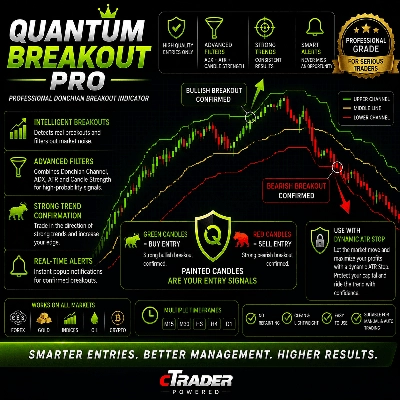
QUANTUM BREAKOUT PRO | — | — | — | $25 | Windows, Mac |
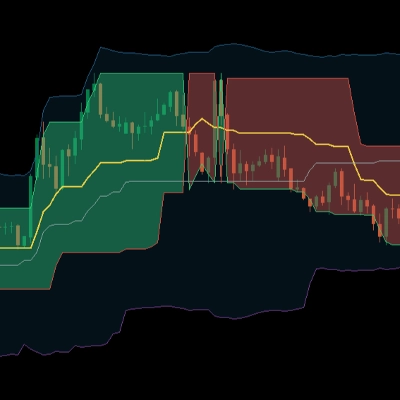
Donchian Flux Cloud | 5.0 (1) | 196 | — | Free | Windows, Mac |
Dynamic Support Resistance with buy sell signal | 4.5 (2) | — | — | $199 | Windows, Mac |
Waddah Attar Explosion | — | 196 | — | Free | Windows, Mac |
Advanced Donchian Zones | 4.4 (5) | — | — | $19 | Windows, Mac |
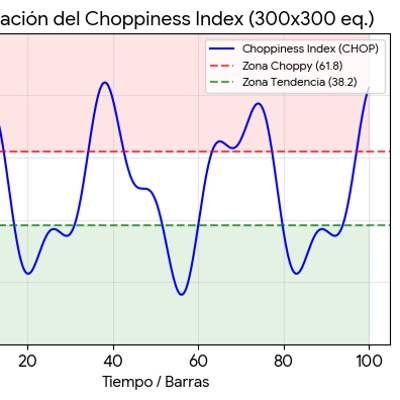
ChoppinessIndex | — | 170 | — | Free | Windows, Mac |
GOLD Breakout breakout Bot | — | — | — | $39 | Windows, Mac, Mobile, Web |
FAQ
A breakout pattern indicator spots consolidation, such as a range, channel or triangle, and flags when price closes beyond its boundary, often alongside rising volatility. It turns structure you could draw by hand into objects and alerts, but it does not judge whether the move will continue.
Nobody can tell in advance, but many look for a close beyond the level rather than a wick, expanding range, and agreement with the higher-timeframe trend. Some wait for a retest of the broken level, yet false breakouts remain common, especially around news releases.
They differ in which patterns they recognise, whether range length and minimum width are adjustable, whether signals wait for a candle close, and how alerts arrive. Read the version history and reviews, then use the Windows or Mac app to run free versions, or a paid tool's trial where offered, side by side on one symbol.
Yes. An indicator only marks the range and the break, while a cBot can send orders under the rules in its code once you start it. The Help Centre's sample breakout cBot, for instance, opens a position when price leaves Bollinger Bands after a run of narrow bars, and false breaks can still produce losses.
Many newcomers study ranges on H4 or daily charts first, where they form slowly and can be marked by hand with cTrader's equidistant channel tool. Lower timeframes produce far more breaks, many of them false, and leave less time to judge each one.