
Descrição
Descrição
Indicadores da Pinescriptlabs Store: 🤖Pinescriptlabs Store cBots :
ICT Power of 3 (cBot) Gold & BTC BreakoutSession Pivots(novo)YieldShield"
SmartTrend Support &
Linhas de Resistência
Sistema de Rompimento de Canal
Estrutura Dinâmica de Mercado
Análise de Pontos de Virada
Fibonacci Linear
Regressão Multitemporal
Gradiente de Tendência Dinâmico
Viés de Vela Multi-Nível
Rastreador
Rastreador de Extremos Zig-Zag
Suporte Automático e
Linhas de Tendência de Resistência
Todos os Suportes e
Níveis de Resistência
Mapa de Liquidação de Alavancagem
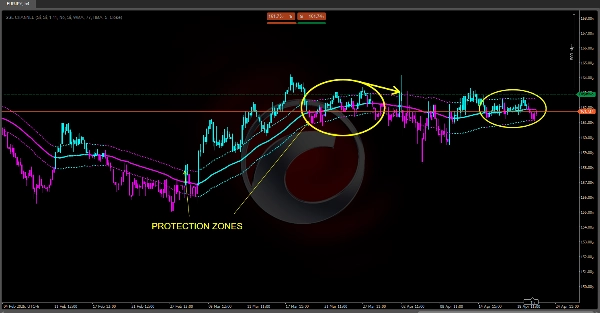
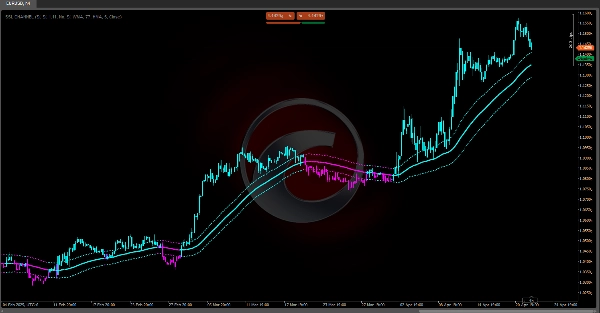
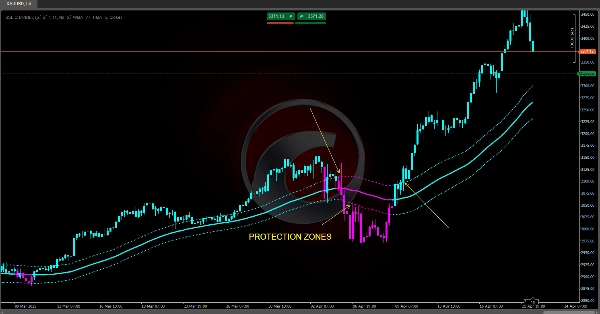
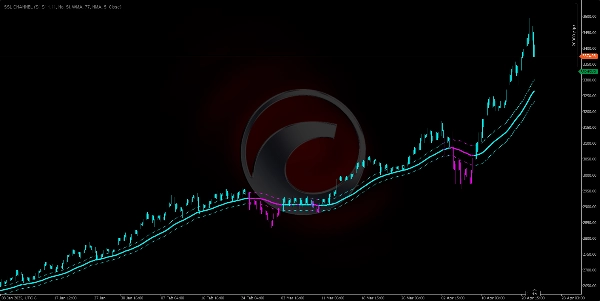
O Canal SSL Premium 🔍
Combina detecção de tendência via uma média móvel, avaliação de volatilidade com bandas baseadas no ATR, e um filtro de curto prazo (SSL) para fornecer um sistema de análise integrado. 💡 Sua força está na clareza dos seus sinais visuais e adaptabilidade em vários mercados, enquanto seu principal desafio é minimizar o atraso e filtrar movimentos laterais. Com a parametrização adequada, torna-se uma ferramenta poderosa para decisões de entrada/saída no trading. 🎯
1. Propósito & Utilidade no Trading 📊
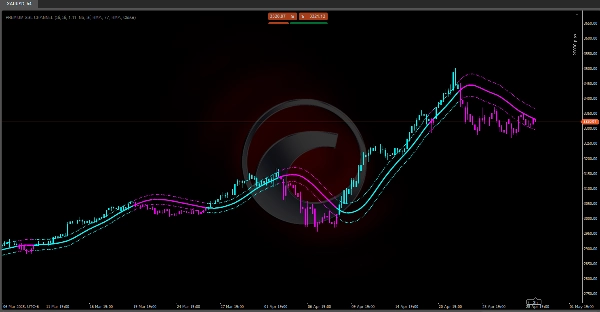
• Detecção da tendência principal: Graças a uma linha central (a "Linha Base"), o indicador mostra a direção dominante do mercado. 📈📉
• Medição de volatilidade: Usando uma faixa média (ATR), ajusta duas bandas (acima/abaixo da Linha Base) como zonas dinâmicas de suporte/resistência. ⚡
• Filtro de ruído & mudança de viés: O canal SSL (uma média móvel adaptativa baseada em máximas/mínimas) identifica reversões de curto prazo para entradas/saídas precisas. 🔄
• Visualização intuitiva: Colore barras de preço e linhas pelo viés (ciano = alta, magenta = baixa) para interpretação instantânea. 🎨
2. Componentes Principais & Lógica ⚙️
2.1. Linha Central ("Linha Base")
• Calcula uma média móvel de preço (SMA, EMA, WMA ou Hull) para suavizar o ruído.
• Representa o valor médio do mercado, mostrando a tendência dominante:
- Preço acima → Tendência de alta. 🟢
- Preço abaixo → Tendência de baixa. 🔴
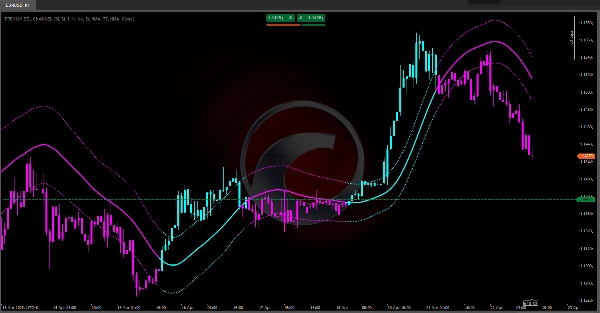
2.2. Faixa Média (ATR)
• Mede a volatilidade real do mercado ao calcular a média das máximas/mínimas/fechamentos anteriores.
• ATR mais alto = Mais volatilidade; ATR mais baixo = Mercados mais calmos. 🌊
2.3. Bandas Dinâmicas ("Up ATR" & "Down ATR")
• Up ATR = Linha Base + (ATR × Multiplicador)
• Down ATR = Linha Base – (ATR × Multiplicador)
• Atua como canais de preço:
- Preço tocando banda superior → Força de alta. 🚀
- Preço próximo da banda inferior → Momentum de baixa. 🐻
2.4. Canal SSL (Signal-Smooth-Line)
• Usa médias móveis nas máximas/mínimas separadamente.
• Lógica de direção:
- Fechamento acima da MA alta → Viés de alta. ✅
- Fechamento abaixo da MA baixa → Viés de baixa. ❌
- Entre os dois → Viés anterior mantém-se.
• Atua como um filtro de tendência de curto prazo, confirmando/contradizendo a Linha Base. 🔄
3. Geração de Sinais & Uso Prático 🛠️
1. Confirmação de Tendência
- Forte Alta: Preço > Up ATR. 🟢
- Alta Moderada: Up ATR > Preço > Linha Base.
- Baixa Moderada: Linha Base > Preço > Down ATR.
- Forte Baixa: Preço < Down ATR. 🔴
2. Filtro SSL
- Entradas: Vá comprado apenas se o SSL estiver acima da sua linha (ou vendido se estiver abaixo). ⬆⬇
- Saídas: Saída parcial/total quando o SSL reverte e cruza a MA alta/baixa oposta. ✋
3. Coloração das Barras
- Barras de preço ficam ciano (alta) ou magenta (baixa), sincronizadas com a Linha Base para leituras rápidas do mercado. 🎨
4. Parâmetros Configuráveis & Impacto ⚖️
• Período da Linha Base: Mais longo = mais suave mas com atraso; mais curto = responsivo mas ruidoso. 🐢⚡
• Multiplicador da Banda: Maior = canal mais largo (menos sinais falsos); menor = mais apertado (mais sinais, mais ruídos). ↔️
• Tipo de MA (SMA/EMA/WMA/HMA): Afeta o peso dos preços recentes vs. históricos. 📅
• Período & Tipo do SSL: Define a sensibilidade do filtro de curto prazo. 🎚️
Resumo
Avaliações de clientes
5 | 100 % | |
4 | 0 % | |
3 | 0 % | |
2 | 0 % | |
1 | 0 % |


