Descripción
📈 Trend Master Pro MultiMA – La herramienta definitiva para la detección de tendencias 🚀
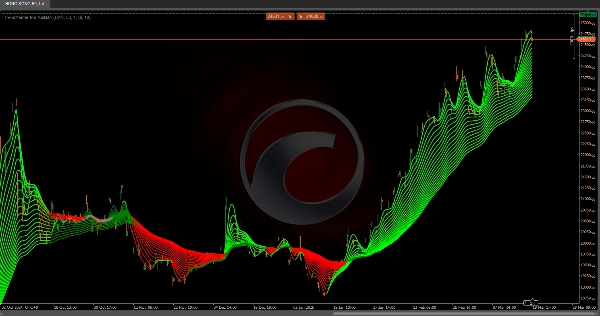
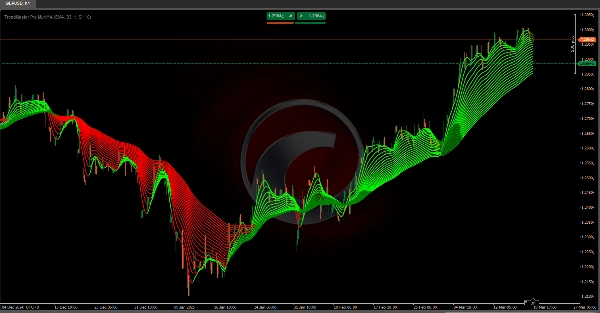
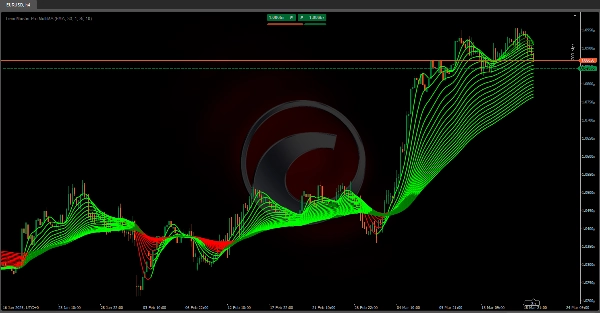
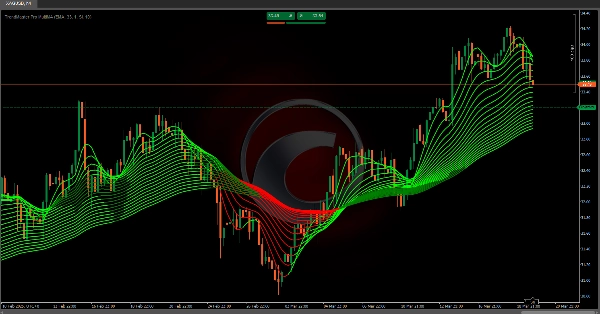
Este indicador traza 20 medias móviles con diferentes períodos (5, 10, 15, 20, 25, 30, 35, 40, 45, 50, 55, 60, 65, 70, 75, 80, 85, 90, 95 y 100). Para cada una:
1️⃣ 📊 Seleccione su tipo de cálculo: Elija entre SMA, EMA, RMA, WMA o VWMA según su preferencia. Opcionalmente, puede activar suavizado por regresión lineal para reducir el ruido y obtener una tendencia más clara.
2️⃣ 📏 Defina el canal de referencia: Se calcula un canal basado en el rango de precios usando las últimas 200 velas. El ancho del canal es ajustable, expandiéndose con mayor volatilidad de precios y contrayéndose en mercados más tranquilos.
3️⃣ 📈 Compare las medias móviles con el canal: Cada media móvil se analiza en relación con la altura del canal y sus propios máximos y mínimos durante un período definido (por defecto: 20 velas).
- 📊 Si la diferencia entre el valor más alto y el más bajo de la media móvil supera el ancho del canal, indica una tendencia fuerte (alcista o bajista).
- ⚖️ Si la diferencia está dentro o cerca del canal, el mercado se considera neutral o en rango.
4️⃣ 🎨 Sistema de coloración basado en la tendencia: Cada segmento de las medias móviles se colorea según la fuerza y dirección de la tendencia:
- 🟢 Verde = Tendencia alcista detectada
- 🔴 Rojo = Tendencia bajista detectada
5️⃣ 📉 Visualización de la tendencia: El indicador conecta cada valor de la media móvil de vela en vela, formando una estructura en abanico de líneas de tendencia. Cada media móvil ajusta dinámicamente su color según la tendencia calculada.
✅ ¿Por qué usar Trend Master Pro MultiMA?
Este enfoque adaptativo multitemporal—combinando múltiples medias móviles, canales de precio y suavizado por regresión—ayuda a identificar rápidamente las fases del mercado:
🔹 Tendencias alcistas ✅
🔹 Tendencias bajistas ❌
🔹 Movimientos laterales/en rango 🔄
🚀 Perfecto para traders que buscan insights visuales claros para tomar mejores decisiones en plazos cortos, medios y largos! 📊🔥
Indicadores de Ctrader Store:
Sesiones de brecha de valor justo
Estructura dinámica del mercado
Análisis de puntos de inflexión
Regresión lineal de Fibonacci
Multitemporal
Brecha de valor justo de momentum
Proyección de flujo de mercado
Gradiente de tendencia dinámico
Sesgo de vela multinivel
Rastreador
Rastreador de extremos Zig-Zag
Líneas de tendencia de soporte y
resistencia automáticas
Todos los niveles de soporte y
resistencia
Resumen
Each moving average is compared against this channel and its own highs and lows over a defined period (default 20 candles). If the range of a moving average exceeds the channel width, it signals a strong bullish or bearish trend; if within or near the channel, the market is considered neutral or ranging. The indicator visually represents trends by connecting moving average values candle-to-candle, forming a fan-like structure of trendlines. Trend strength and direction are indicated by color coding: green for bullish and red for bearish trends.
This multi-timeframe adaptive tool integrates multiple moving averages, price channels, and regression smoothing to help traders quickly identify market phases—bullish, bearish, or ranging—across short, medium, and long-term timeframes.
Valoraciones de clientes
5 | 100 % | |
4 | 0 % | |
3 | 0 % | |
2 | 0 % | |
1 | 0 % |