Beschreibung
📈 Trend Master Pro MultiMA – Das ultimative Werkzeug zur Trenderkennung 🚀
Dieser Indikator zeichnet 20 gleitende Durchschnitte mit unterschiedlichen Perioden (5, 10, 15, 20, 25, 30, 35, 40, 45, 50, 55, 60, 65, 70, 75, 80, 85, 90, 95 und 100). Für jeden einzelnen:
1️⃣ 📊 Wählen Sie Ihren Berechnungstyp: Wählen Sie zwischen SMA, EMA, RMA, WMA oder VWMA je nach Präferenz. Optional können Sie lineare Regressionsglättung aktivieren, um Rauschen zu reduzieren und einen klareren Trend zu erhalten.
2️⃣ 📏 Definieren Sie den Referenzkanal: Ein preisbereichsbasierter Kanal wird unter Verwendung der letzten 200 Kerzen berechnet. Die Kanalbreite ist anpassbar und erweitert sich bei höherer Preisvolatilität und zieht sich in ruhigeren Märkten zusammen.
3️⃣ 📈 Vergleichen Sie gleitende Durchschnitte mit dem Kanal: Jeder gleitende Durchschnitt wird in Bezug auf die Höhe des Kanals und seine eigenen Hochs & Tiefs über einen definierten Zeitraum (Standard: 20 Kerzen) analysiert.
- 📊 Wenn die Differenz zwischen dem höchsten und niedrigsten Wert des gleitenden Durchschnitts die Kanalbreite überschreitet, signalisiert dies einen starken Trend (bullisch oder bärisch).
- ⚖️ Wenn die Differenz innerhalb oder nahe am Kanal liegt, wird der Markt als neutral oder seitwärts tendierend betrachtet.
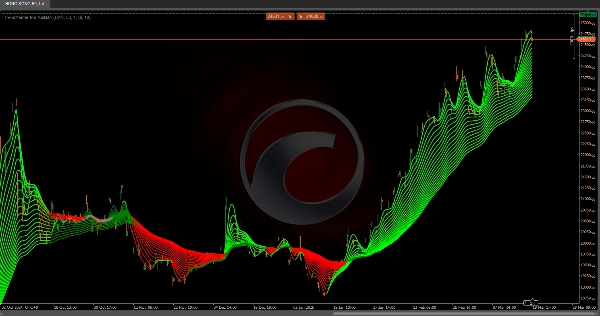
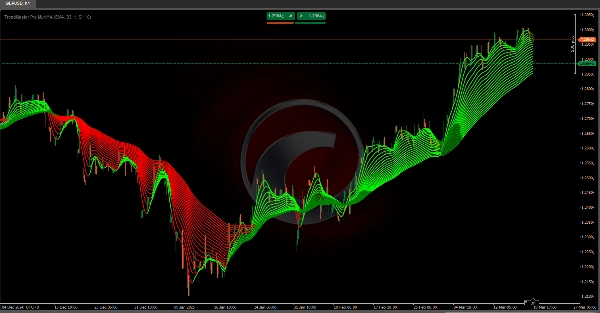
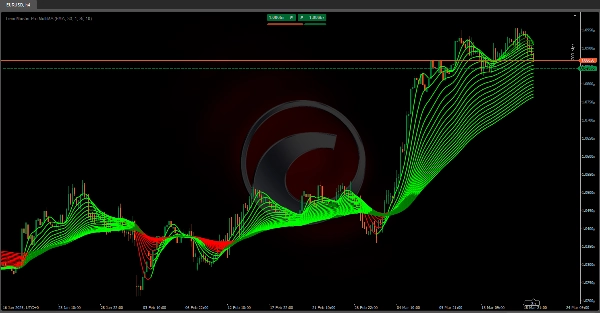
4️⃣ 🎨 Trendbasiertes Farbsystem: Jeder Abschnitt der gleitenden Durchschnitte wird entsprechend der Trendstärke und -richtung eingefärbt:
- 🟢 Grün = Bullischer Trend erkannt
- 🔴 Rot = Bärischer Trend erkannt
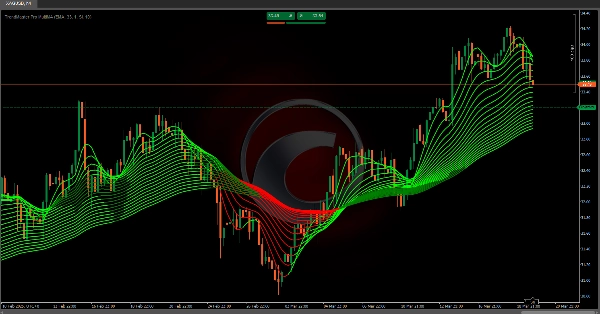
5️⃣ 📉 Visualisierung des Trends: Der Indikator verbindet jeden Wert des gleitenden Durchschnitts von Kerze zu Kerze und bildet eine fächerartige Struktur aus Trendlinien. Jeder gleitende Durchschnitt passt seine Farbe dynamisch basierend auf dem berechneten Trend an.
✅ Warum Trend Master Pro MultiMA verwenden?
Dieser mehrzeitrahmenadaptive Ansatz—der mehrere gleitende Durchschnitte, Preiskanäle und Regressionsglättung kombiniert—hilft dabei, Marktphasen schnell zu erkennen:
🔹 Bullische Trends ✅
🔹 Bärische Trends ❌
🔹 Seitwärtsbewegungen 🔄
🚀 Perfekt für Trader, die klare visuelle Einblicke suchen, um bessere Entscheidungen in kurzen, mittleren und langen Zeitrahmen zu treffen! 📊🔥
Ctrader Store Indikatoren:
Dynamic Market Structure
Analyse von Wendepunkten
Fibonacci Linear
Regression Multi-Timeframe
Multi-Level Candle Bias
Tracker
Auto Support and
Resistance Trend Lines
Zusammenfassung
Each moving average is compared against this channel and its own highs and lows over a defined period (default 20 candles). If the range of a moving average exceeds the channel width, it signals a strong bullish or bearish trend; if within or near the channel, the market is considered neutral or ranging. The indicator visually represents trends by connecting moving average values candle-to-candle, forming a fan-like structure of trendlines. Trend strength and direction are indicated by color coding: green for bullish and red for bearish trends.
This multi-timeframe adaptive tool integrates multiple moving averages, price channels, and regression smoothing to help traders quickly identify market phases—bullish, bearish, or ranging—across short, medium, and long-term timeframes.
Kundenbewertungen
5 | 100 % | |
4 | 0 % | |
3 | 0 % | |
2 | 0 % | |
1 | 0 % |