📈 Signal Moving Average 📉
The Signal Moving Average is an indicator that combines a Simple Moving Average (SMA) with a dynamic correlation calculation to better adapt to market conditions. 🎯 This indicator adjusts its sensitivity based on the strength of the trend, making it a powerful tool for identifying trends and filtering out market noise. 🌟
Key Features 🔑
📊 Adjusted Moving Average:
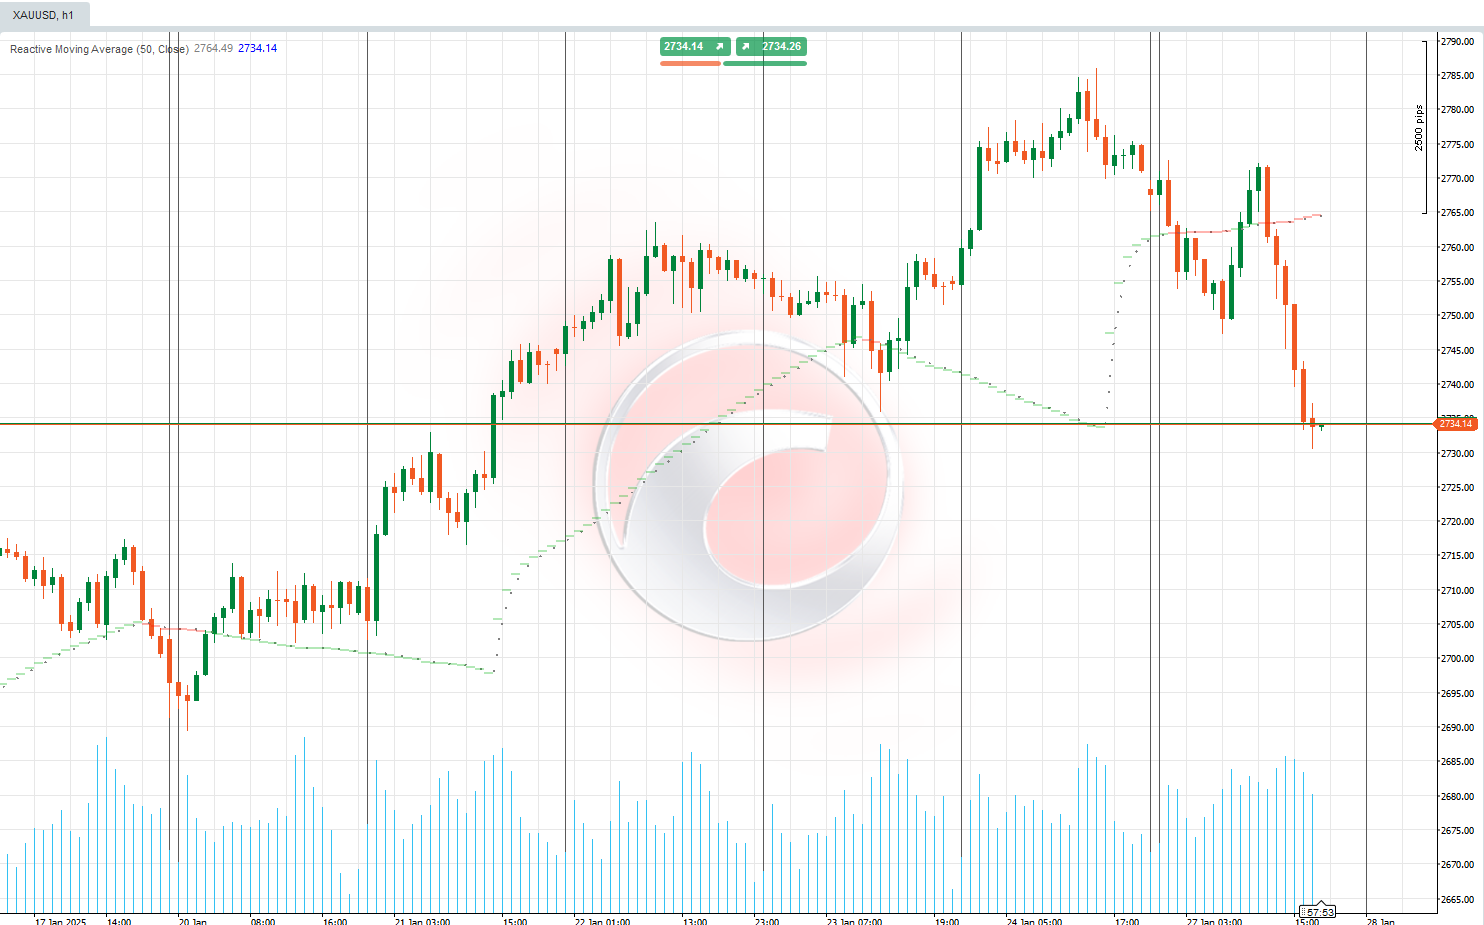
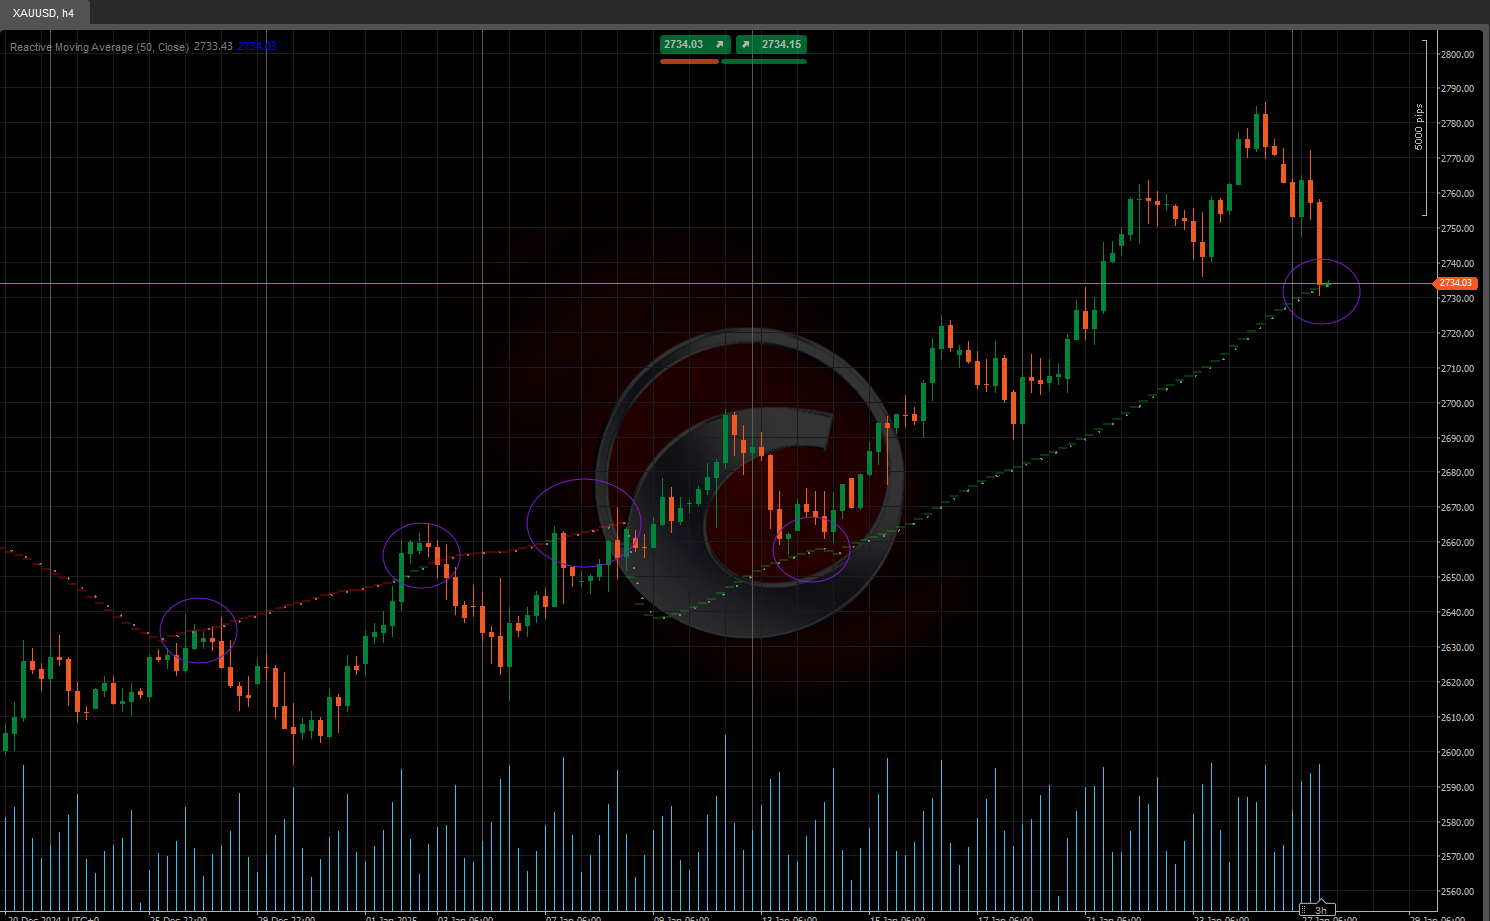
- The moving average line dynamically adjusts based on the correlation between price and time.
- In strong trending markets, the moving average moves faster to follow the price. 🚀
- In sideways markets, the moving average remains more stable, reducing false signals. 🛑
🔢 Correlation Calculation:
- The indicator calculates the correlation between price and time using the Pearson formula.
- It adjusts the moving average based on the coefficient of determination (R²). 🧮
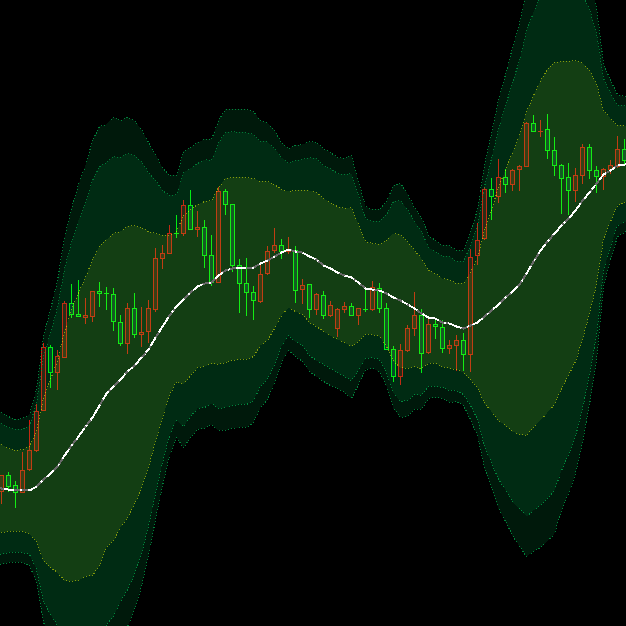
👀 Visualization:
- Clear and intuitive display for easy interpretation. 📉📈
How to Use the Indicator 🛠️
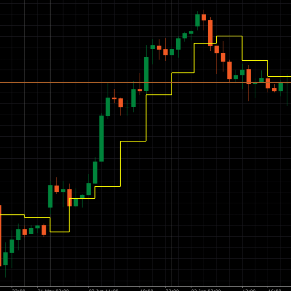
🔍 Trend Identification:
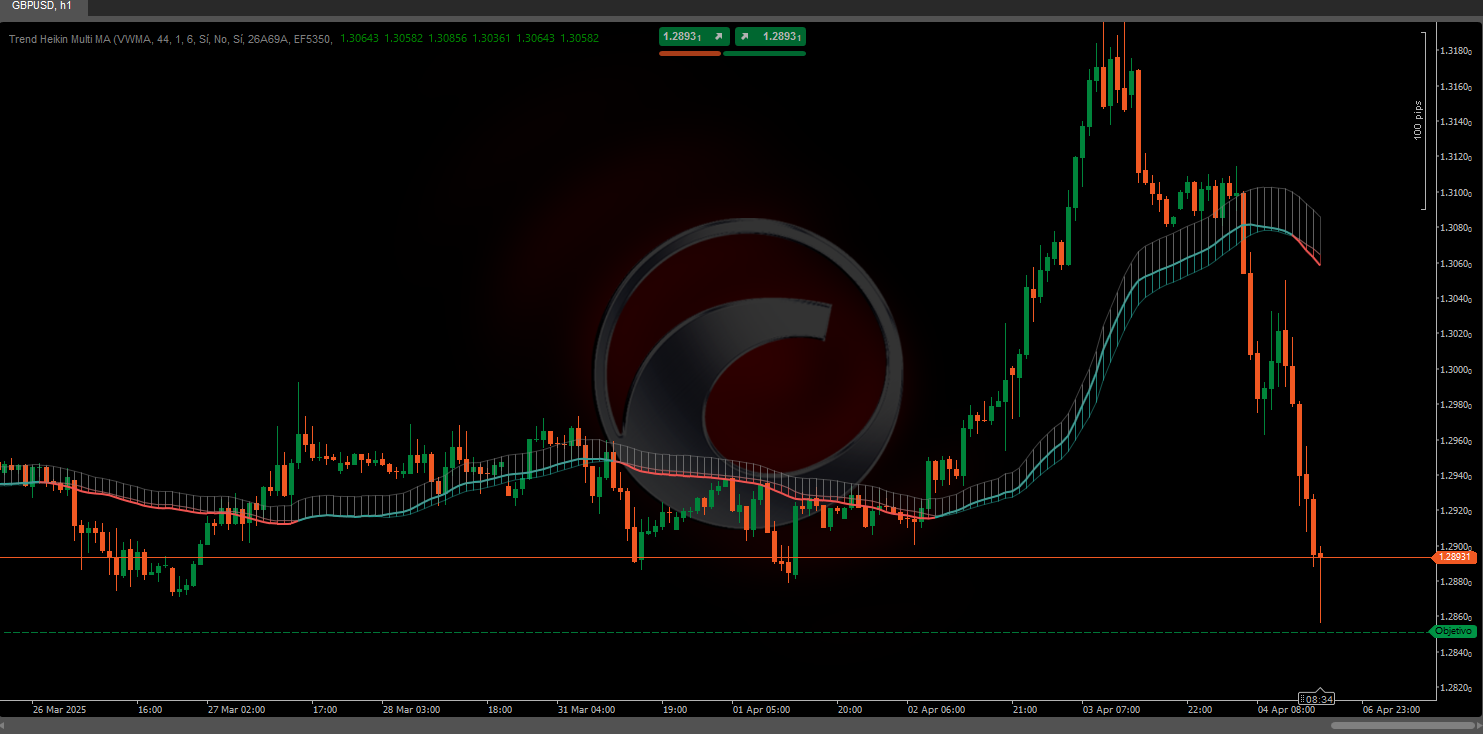
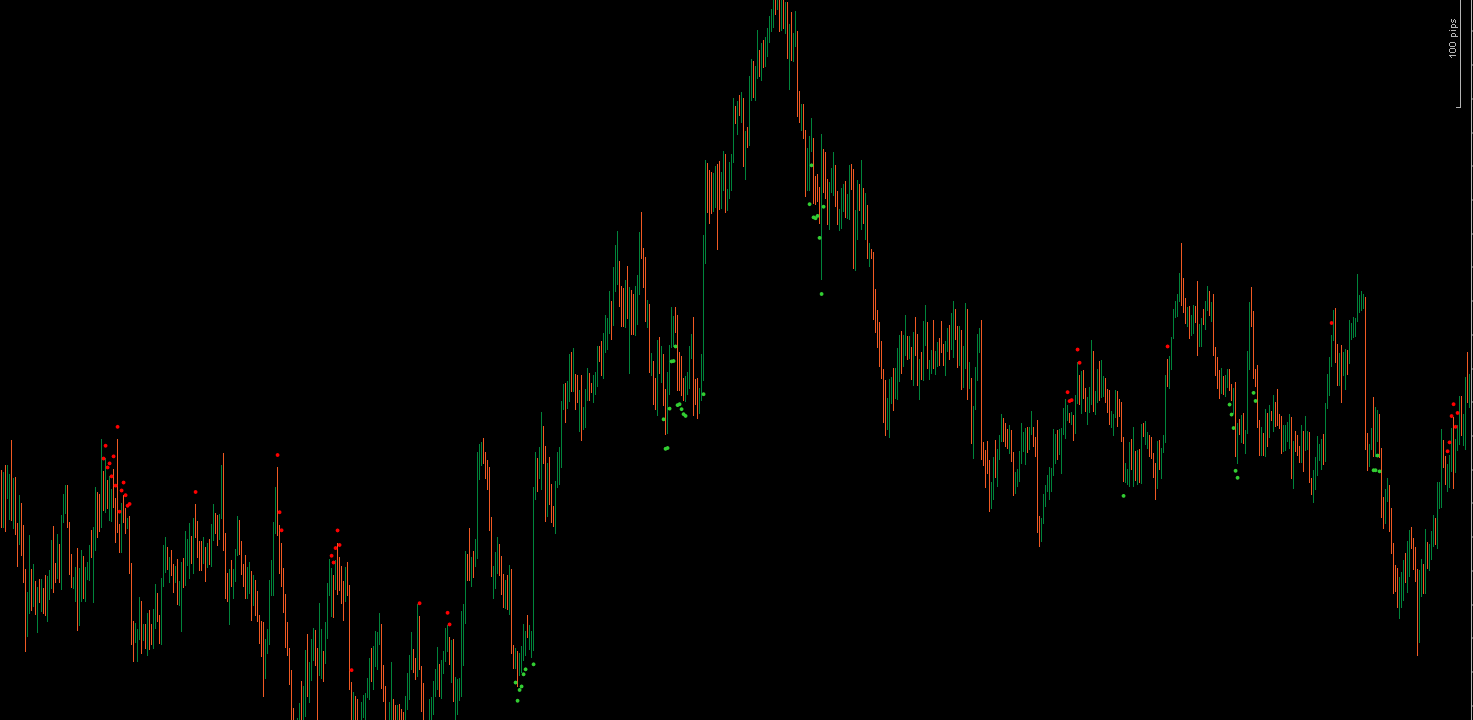
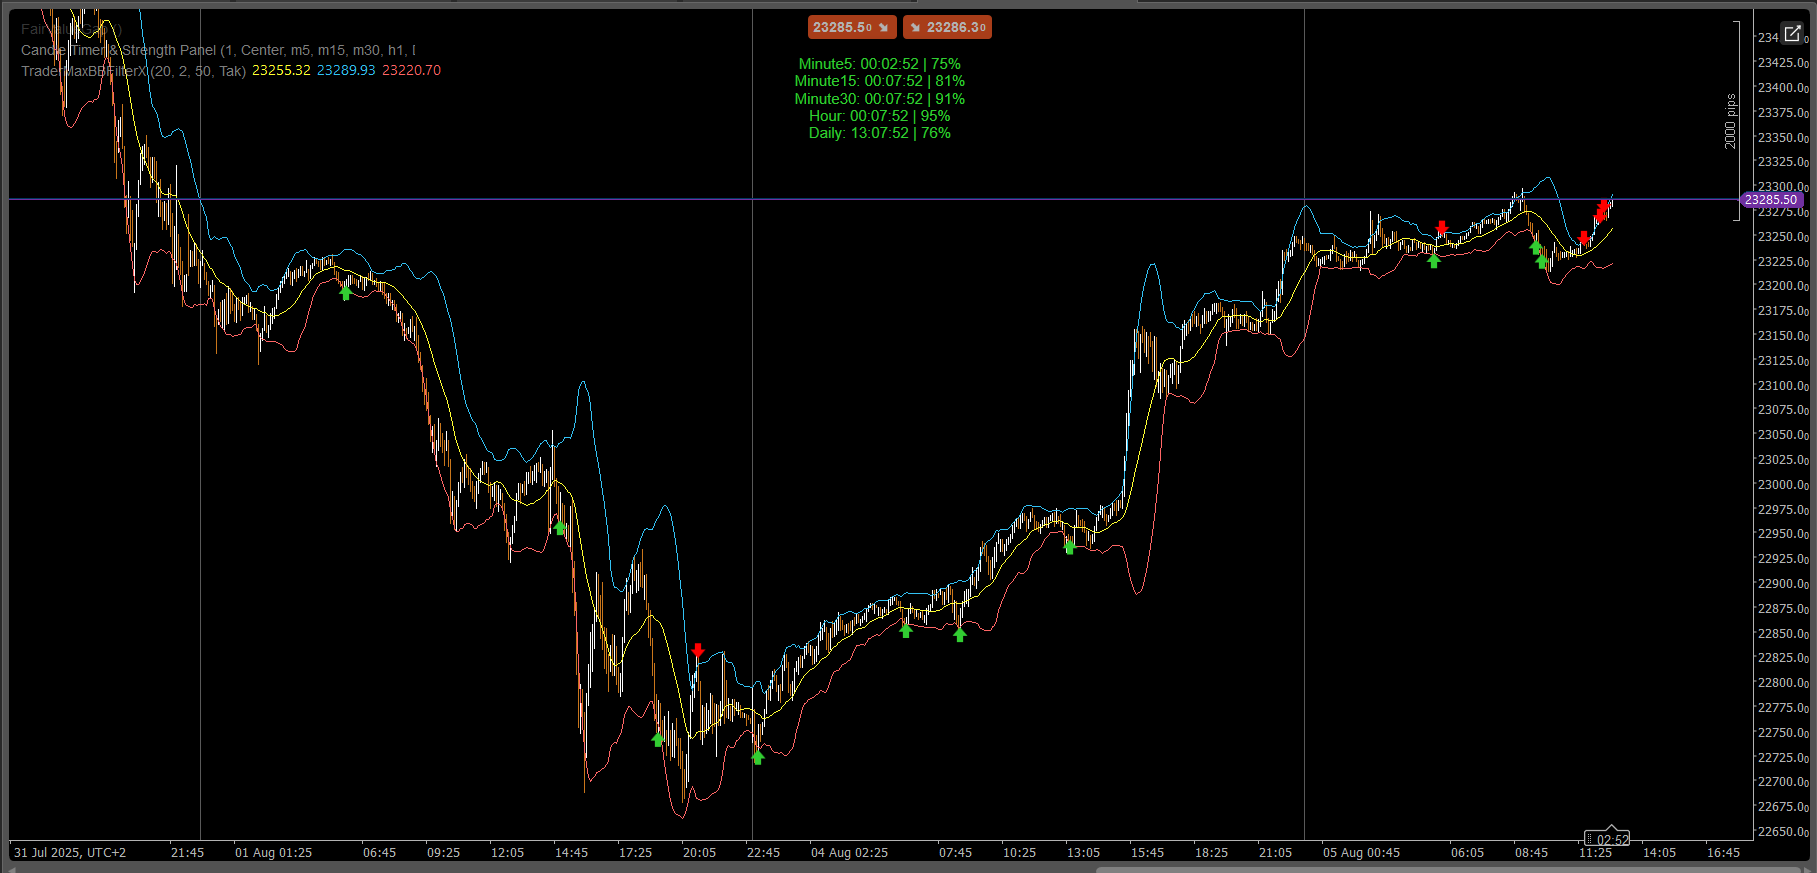
- Bullish Trend: When the price is above the correlated moving average. 🐂
- Bearish Trend: When the price is below the correlated moving average. 🐻
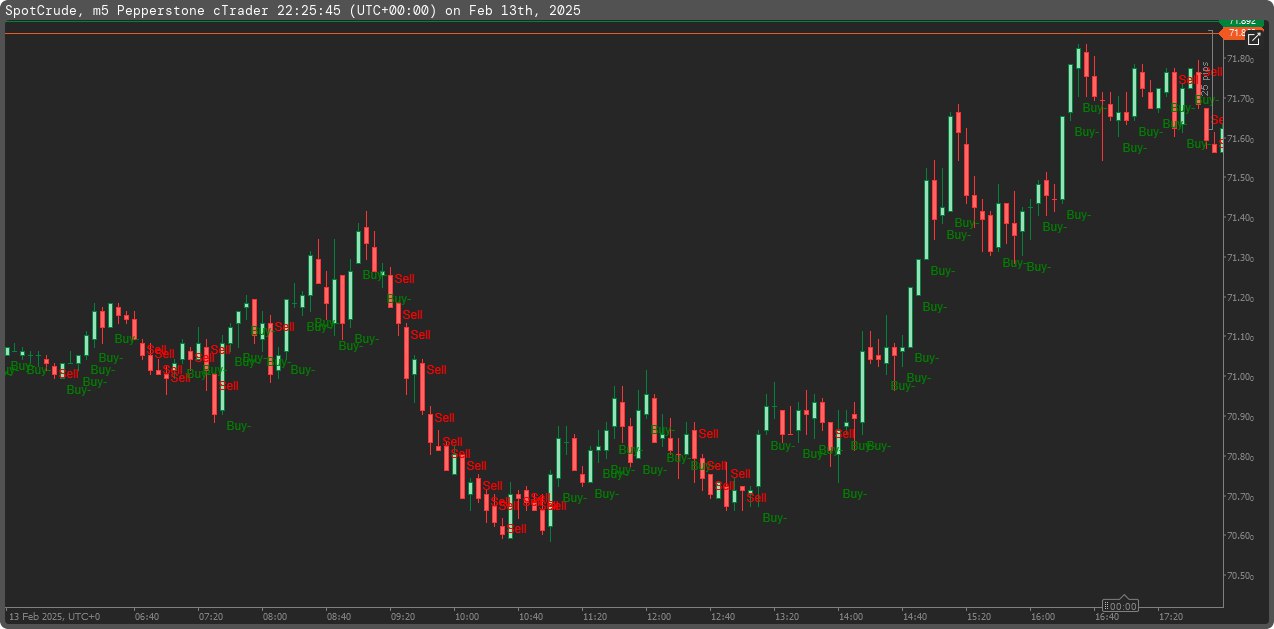
✅ Signal Confirmation:
- Use the adjusted moving average as a dynamic support or resistance level. 🛡️
- Combine this indicator with other technical tools to confirm signals. 🔄
Moving Average Adjustment ⚙️
The algorithm adjusts the moving average based on the value of R²:
- If R² > 0.5 (significant correlation):
- The moving average is adjusted using a weighted combination between the current SMA value and the previous value of the adjusted moving average (_ma).
- The weighting depends on the value of R². ⚖️
- If R² ≤ 0.5 (non-significant correlation):
- The moving average is adjusted by subtracting a value proportional to the absolute difference between the current SMA value and the previous value of the adjusted moving average. 🔄
- Ctrader Store indicators:
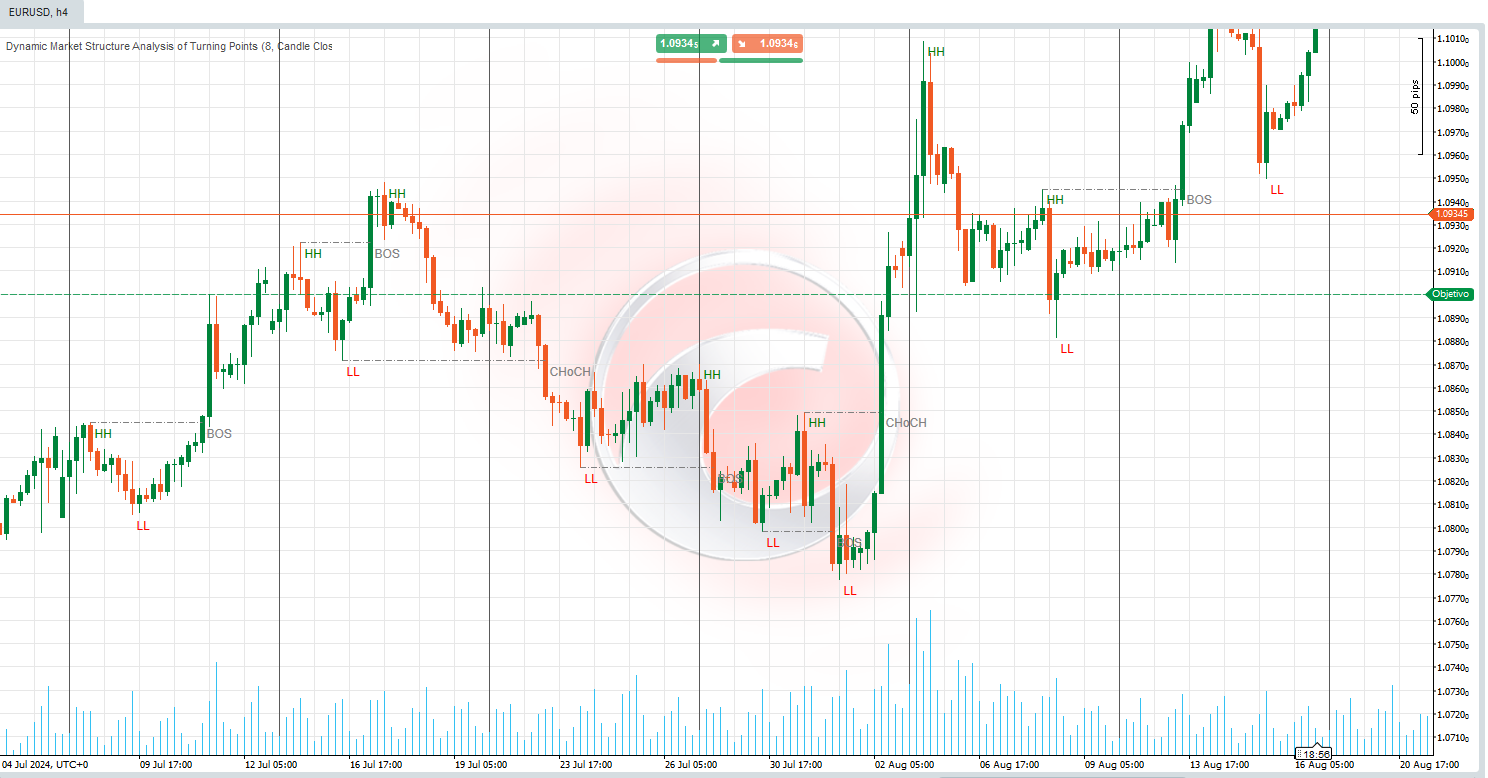
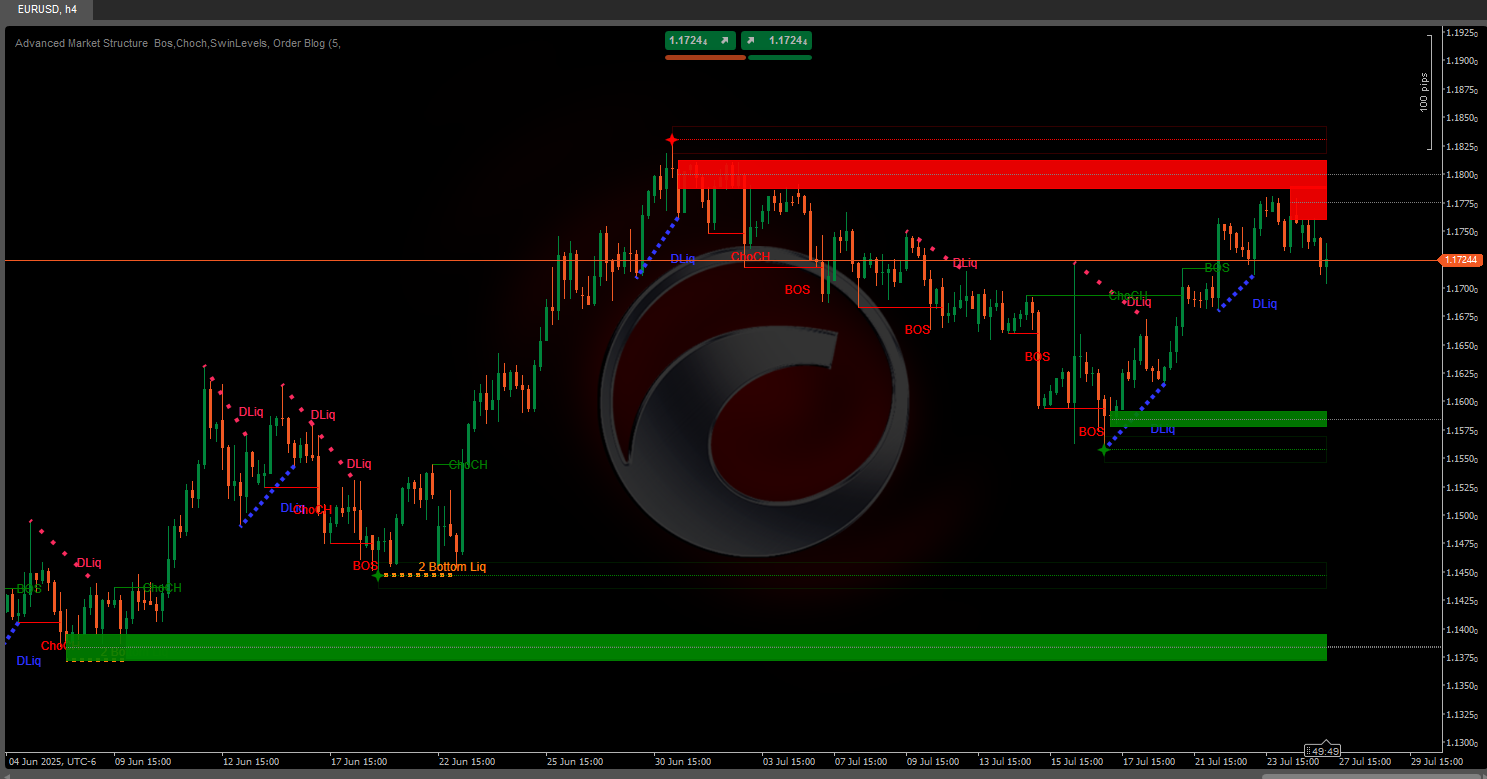
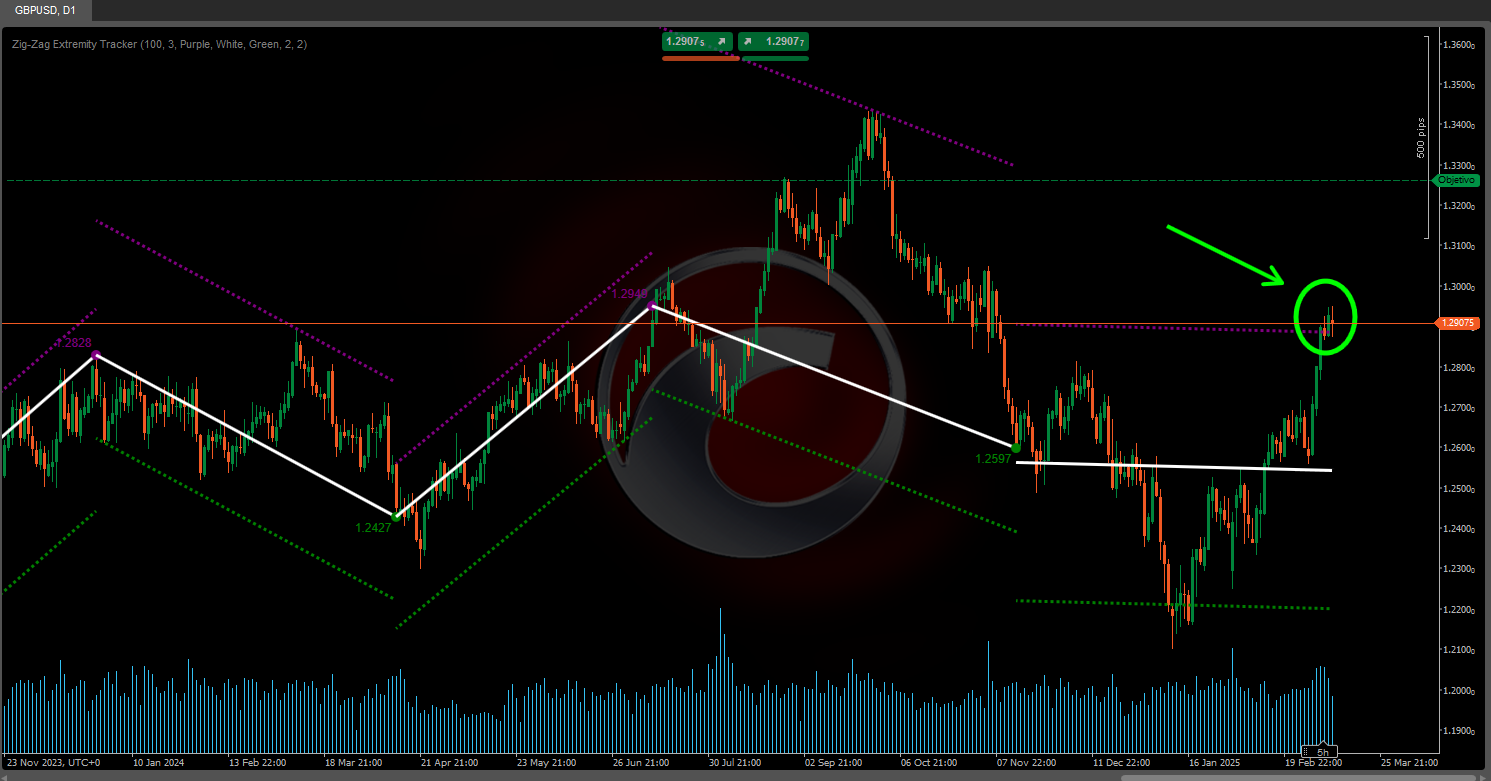
Dynamic Market Structure
Analysis of Turning Points
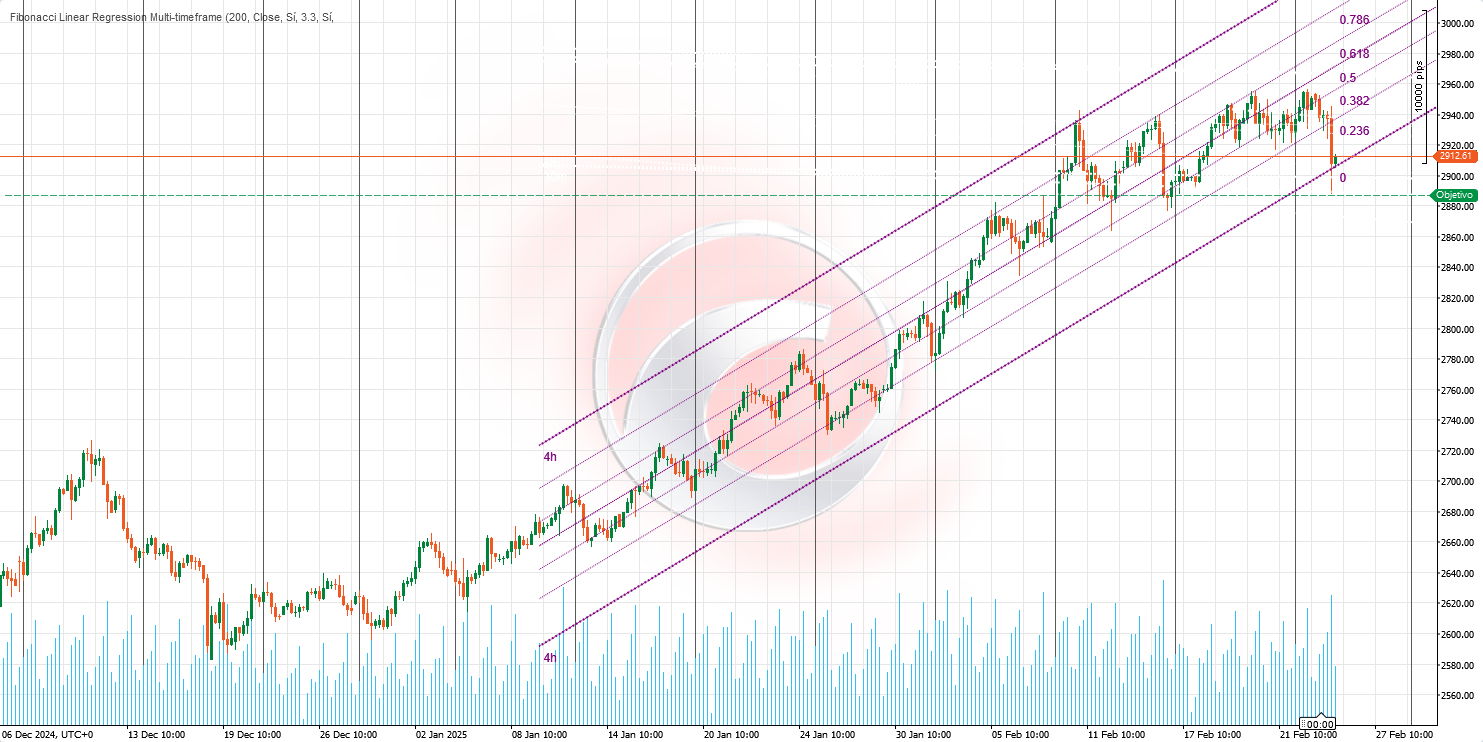
Fibonacci Linear
Regression Multi-timeframe
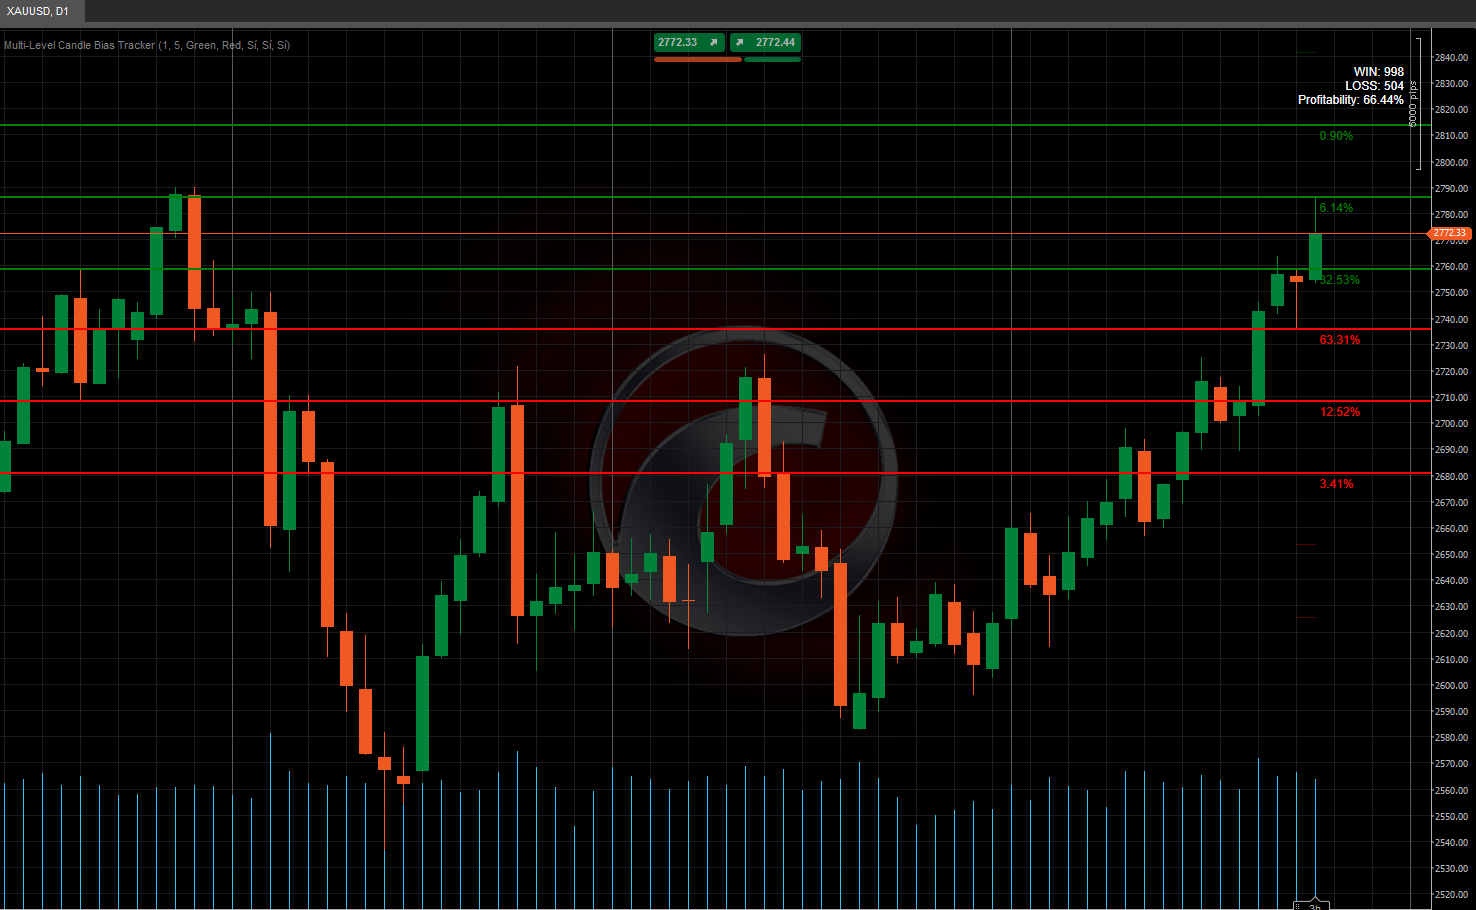
Multi-Level Candle Bias
Tracker
Auto Support and
Resistance Trend Lines