
Descrição
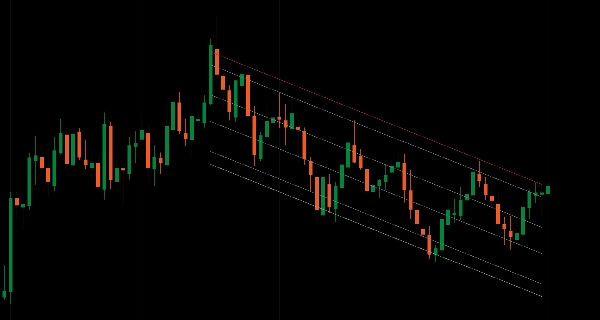
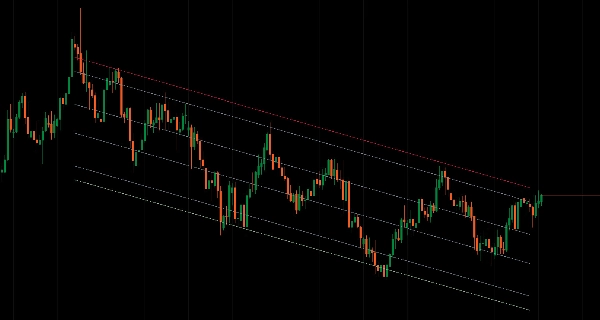
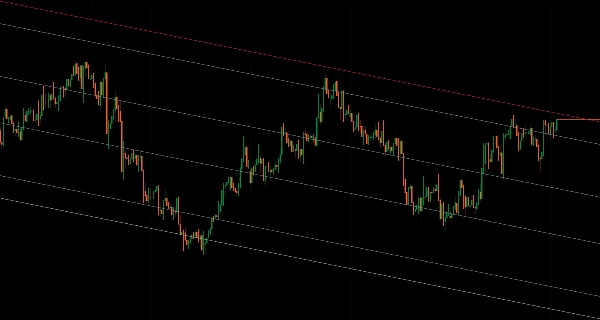
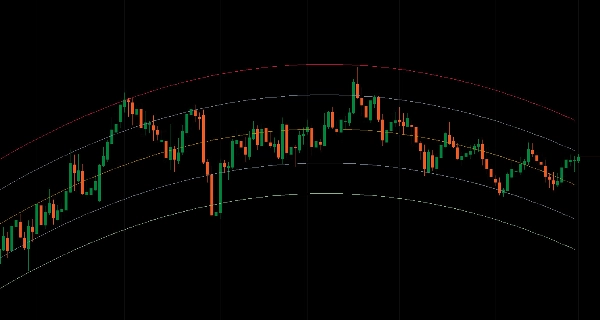
Canais de regressão estatística com níveis de Fibonacci em vários tipos de cálculo, prazos e intervalos de datas.
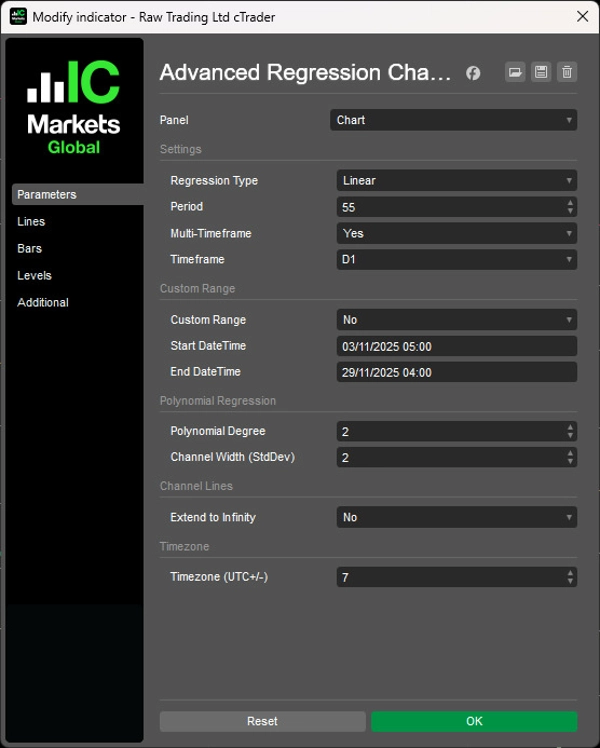
Ajusta linhas de regressão através dos dados de preço usando oito métodos (Linear, Logarítmico, Exponencial, Ponderado, Polinomial, Móvel, Média Móvel Exponencial, LOWESS) com bandas de desvio padrão para análise de reversão à média.
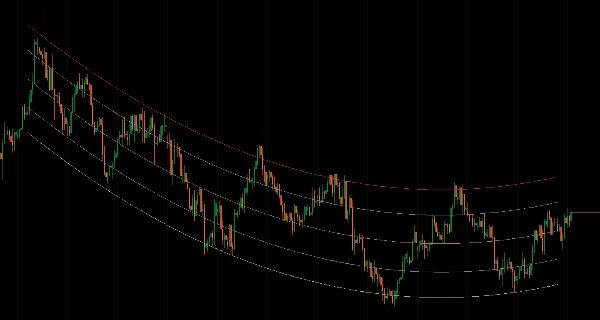
Nove níveis do canal Fibonacci (0% a 100%), análise multi-temporal em 16 períodos com renderização interpolada, três modos de cálculo (Baseado em Período, Intervalo de Datas, MTF), controle do grau do polinômio (1-5) para estruturas de tendência curvas, multiplicador de desvio padrão para ajuste da largura do canal, análise de eventos com parsing de data/hora sensível ao fuso horário, projeção da linha de tendência estendida ao infinito e cache LRU otimizado oferecem uma análise estatística de regressão abrangente para traders que buscam zonas de reversão à média e estruturas de preço curvas em diversas condições de mercado.
RECURSOS
8 Tipos de Cálculo de Regressão
- Linear: Regressão linear clássica de mínimos quadrados
- Logarítmico: Regressão baseada em logaritmo natural para movimentos exponenciais de preço
- Exponencial: Ajuste de curva exponencial para tendências aceleradas
- Ponderado: Regressão linear com barras recentes ponderadas mais fortemente
- Polinomial: Ajustes curvos (grau 1-5) para tendências não lineares
- Móvel: Regressão baseada em média móvel
- Média Móvel Exponencial: Regressão baseada em EMA para suavização de tendência
- LOWESS: Regressão ponderada localmente para suavização adaptativa
9 Níveis do Canal Fibonacci
- Faixa completa do canal: 100% (superior), 88,6%, 76,4%, 61,8%, 50% (linha média), 38,2%, 23,6%, 11,4%, 0% (inferior)
- Zonas de reversão à média dentro das bandas de regressão
- Pontos de referência precisos de suporte/resistência
- Controle independente de cor/estilo/espessura para cada nível
Análise Multi-Temporal
- Calcule regressão em prazo superior, exiba no gráfico atual
- 16 prazos disponíveis (m1 a Mensal)
- Valores do canal interpolados para renderização suave entre barras do gráfico
- Estrutura de prazo superior sem troca de gráficos
3 Modos de Cálculo
- Baseado em Período: Janela móvel de N barras (padrão)
- Intervalo de Datas: Data/hora inicial/final personalizada para eventos ou fases específicas com parsing de data/hora sensível ao fuso horário (deslocamento UTC+/-)
Opções de Exibição do Canal
- Saída padrão: Plote todos os 9 níveis como linhas do indicador
- Estender ao Infinito: Renderize como linhas de tendência que projetam indefinidamente para frente
- Atualização automática quando cores/estilos mudam
- Renderização limpa—sem valores residuais além da janela de cálculo
Modo Intervalo de Datas
- Defina datas exatas de início/fim (formato dd/MM/yyyy HH:mm)
- Analise eventos, fases ou estruturas específicas do mercado
- Independente do parâmetro de período
- Conversão de fuso horário do horário local do usuário para o horário do servidor
Cálculo Dinâmico
- Atualizações em tempo real conforme novas barras se formam
- Cache LRU otimizado com rastreamento de intervalo sujo
- Dimensionamento adaptativo do cache baseado no prazo
- Busca binária para consultas rápidas de intervalo de datas
Controle da Largura do Canal
- Multiplicador de desvio padrão (padrão 2.0)
- Bandas mais largas para expansão de volatilidade
- Bandas mais estreitas para mercados com faixa limitada
- Consistente em todos os tipos de regressão
Regressão Polinomial
- Controle do grau: 1-5 (maior = mais curvatura)
- Captura tendências não lineares
- Útil para estruturas de preço parabólicas ou curvas
- Retorna à linear quando grau = 1
Gerenciamento Visual Limpo
- Nenhum cálculo na barra em formação—apenas barras completas
- Truncamento adequado multi-temporal—linhas terminam na última barra HTF completa
- Extrapolação baseada em inclinação para projeção direcional consistente
- Séries de saída claras com nomes descritivos dos níveis
__________________________________________________________________________________________
MAIS INDICADORES GRATUITOS
Explore uma ampla gama de ferramentas de análise de mercado—desde estrutura e volume até regressão, volatilidade e prazos personalizados.
O código-fonte está disponível no repositório GitHub.
Todos gratuitos para uso. Mas se quiser enviar um suporte para café, você pode fazer isso aqui.
Suporte/Resistência
Volume
- Perfilador de Atividade de Volume
- Analisador de Eficiência de Volume
- Análise de Perfil de Volume
- Perfil de Volume - Atualizado
- Análise de Spread de Volume
- VWAP (Preço Médio Ponderado por Volume)
Médias Móveis
- Canal SSL
- Média Móvel Ancorada
- Média Móvel Escalonada por Desvio
- Ativador Gann High Low
- Linha de Tendência Instantânea
- MA Adaptativa Kaufman com Visão de Tendência
- Canal de Média Móvel
- Conjunto de Médias Móveis
- Média Móvel do Canal de Tendência
Utilitários/Personalizados
Baseado em Regressão
Volatilidade
Osciladores
__________________________________________________________________________________________
AVISO LEGAL
Negociar envolve riscos. Este indicador é destinado apenas para análise técnica — sempre aplique gerenciamento de risco adequado e negocie com responsabilidade.
FEEDBACK & MELHORIAS
Se você tiver sugestões, pedidos de recursos ou ideias para aprimoramento, por favor deixe um comentário na aba Discussão. Seu feedback ajuda a melhorar o indicador para todos.
Resumo
It offers multi-timeframe analysis across 16 periods (from 1 minute to monthly), enabling regression calculations on higher timeframes displayed on the current chart with smooth interpolated rendering. Users can select among three calculation modes: Period-Based (rolling window), Date Range (custom start/end with timezone-aware parsing), and Multi-Timeframe. Channel width is adjustable via a standard deviation multiplier to reflect market volatility.
The indicator features real-time dynamic updates, optimized caching for performance, and extend-to-infinity trendline projections for forward-looking analysis. Visual output is clean, with slope-based extrapolation and no calculations on forming bars. This tool is designed for traders analyzing mean reversion and complex price structures across various market conditions.


![Logótipo de "[Stellar Strategies] Inside Bar with Signals"](https://cdn.ctrader.com/image/webp/1d9e8bfa-3b2c-4440-bb37-5856902008a7_30683)


