
Penerangan
📈 Purata Pergerakan Isyarat 📉
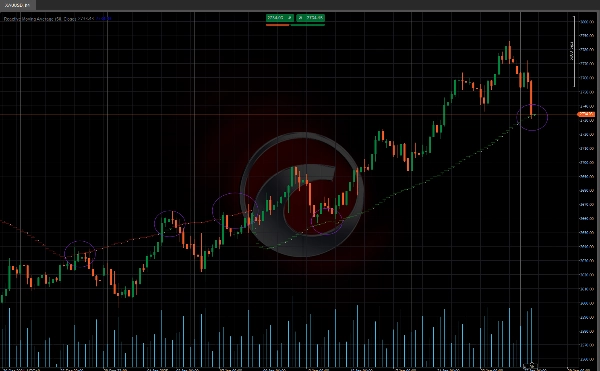
The Purata Pergerakan Isyarat adalah penunjuk yang menggabungkan Purata Pergerakan Mudah (SMA) dengan pengiraan korelasi dinamik untuk menyesuaikan diri dengan keadaan pasaran dengan lebih baik. 🎯 Penunjuk ini menyesuaikan kepekaannya berdasarkan kekuatan trend, menjadikannya alat yang berkuasa untuk mengenal pasti trend dan menapis bunyi pasaran. 🌟
Ciri Utama 🔑
📊 Purata Pergerakan Disesuaikan:
- Garis purata pergerakan menyesuaikan secara dinamik berdasarkan korelasi antara harga dan masa.
- Dalam pasaran yang kuat bertrend, purata pergerakan bergerak lebih pantas untuk mengikuti harga. 🚀
- Dalam pasaran mendatar, purata pergerakan kekal lebih stabil, mengurangkan isyarat palsu. 🛑
🔢 Pengiraan Korelasi:
- Penunjuk mengira korelasi antara harga dan masa menggunakan formula Pearson.
- Ia menyesuaikan purata pergerakan berdasarkan koefisien penentuan (R²). 🧮
👀 Visualisasi:
- Paparan jelas dan intuitif untuk tafsiran mudah. 📉📈
Cara Menggunakan Penunjuk 🛠️
🔍 Pengenalpastian Trend:
- Trend Bullish: Apabila harga berada di atas purata pergerakan berkorelasi. 🐂
- Trend Bearish: Apabila harga berada di bawah purata pergerakan berkorelasi. 🐻
✅ Pengesahan Isyarat:
- Gunakan purata pergerakan yang disesuaikan sebagai tahap sokongan atau rintangan dinamik. 🛡️
- Gabungkan penunjuk ini dengan alat teknikal lain untuk mengesahkan isyarat. 🔄
Penyesuaian Purata Pergerakan ⚙️
Algoritma menyesuaikan purata pergerakan berdasarkan nilai R²:
- Jika R² > 0.5 (korelasi signifikan):
-
- Purata pergerakan disesuaikan menggunakan gabungan berwajaran antara nilai SMA semasa dan nilai purata pergerakan yang disesuaikan sebelumnya (_ma).
- Pemberatan bergantung pada nilai R². ⚖️
- Jika R² ≤ 0.5 (korelasi tidak signifikan):
-
- Purata pergerakan disesuaikan dengan menolak nilai yang berkadar dengan perbezaan mutlak antara nilai SMA semasa dan nilai purata pergerakan yang disesuaikan sebelumnya. 🔄
- Penunjuk Kedai Ctrader:
Struktur Pasaran Dinamik
Analisis Titik Pusing
Fibonacci Linear
Regresi Multi-masa
Bias Lilin Berbilang Tahap
Penjejak
Garis Trend Sokongan dan
Rintangan Auto
Ringkasan
Ulasan pelanggan
5 | 100 % | |
4 | 0 % | |
3 | 0 % | |
2 | 0 % | |
1 | 0 % |


