Penerangan
Pinescritlabs
Penunjuk Kedai Ctrader: 🤖Pinescritlabs cBots Kedai Ctrader:
Sesi Jurang Nilai Adil Pivots Sesi Pecahan Emas & BTC(baru)
Struktur Pasaran Dinamik
Analisis Titik Pusing
Fibonacci Linear
Regresi Multi-jangka masa
Bias Lilin Pelbagai Tahap
Penjejak
Garis Trend Sokongan dan
Rintangan Auto
Semua Tahap Sokongan dan
Rintangan
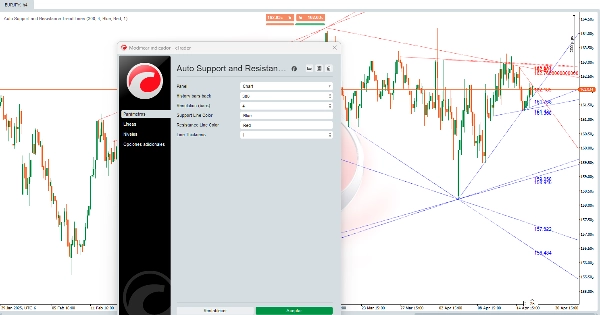
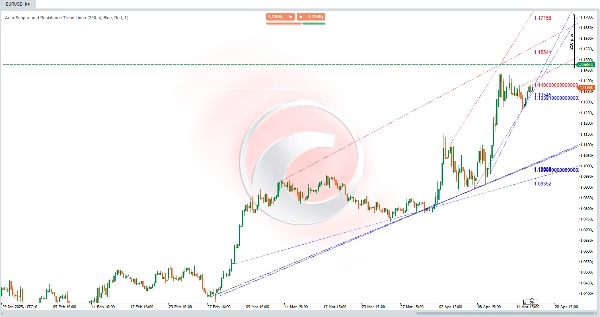
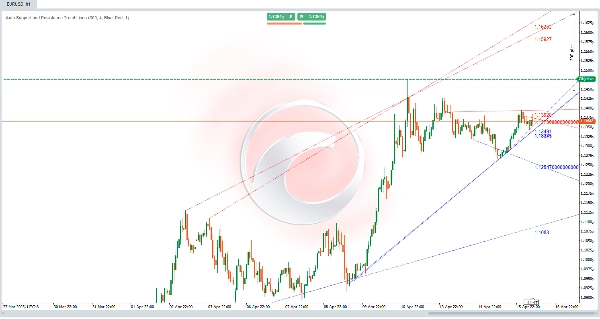
Garis Trend Sokongan dan Rintangan Auto:
Algoritma ini adalah alat yang kuat 🛠️ direka untuk secara automatik mengenal pasti tahap sokongan dan rintangan pada carta harga. Ia bukan sahaja melukis garis mendatar, tetapi juga menjejaki saluran serong ↗️↘️ yang mewakili trend pasaran. Tahap dan saluran ini adalah kawasan utama di mana harga menghadapi kesukaran untuk bergerak lebih tinggi (rintangan 🚧) atau lebih rendah (sokongan 🛡️), menjadikannya titik penting untuk keputusan perdagangan. 📈📉
Bagaimana Pengiraan Dilakukan? 🔍
Algoritma menggunakan pendekatan analisis sejarah harga 📊 untuk mengenal pasti tahap sokongan dan rintangan. Berikut adalah cara ia berfungsi:
- Pengenalpastian Rendah dan Tinggi Tempatan ⬇️⬆️
-
- Algoritma menganalisis harga dalam julat bar (lilin) tertentu untuk mencari rendah tempatan (harga terendah dalam julat itu) dan tinggi tempatan (harga tertinggi dalam julat itu).
- Rendah dan tinggi tempatan ini adalah calon berpotensi untuk menjadi tahap sokongan dan rintangan.
- Pengesahan Tahap ✔️
-
- Setelah rendah dan tinggi tempatan dikenal pasti, algoritma memeriksa sama ada tahap ini telah dihormati oleh harga pada masa lalu.
- Jika harga telah menyentuh tahap tersebut beberapa kali tanpa memecahkannya dengan jelas, ia dianggap sebagai tahap sokongan atau rintangan yang sah.
- Melukis Garis dan Saluran ✏️
-
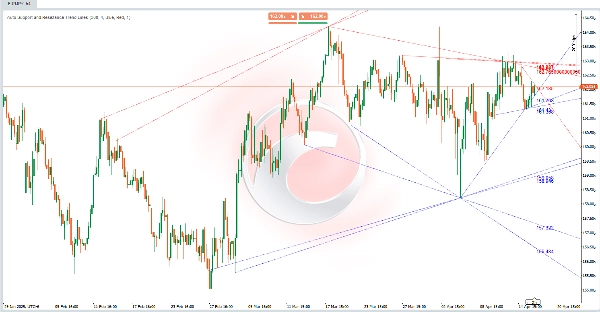
- Tahap sokongan dilukis sebagai garis mendatar (atau serong) pada rendah tempatan yang disahkan.
- Tahap rintangan dilukis sebagai garis mendatar (atau serong) pada tinggi tempatan yang disahkan.
- Selain itu, algoritma menghubungkan tahap ini untuk membentuk saluran serong ↗️↘️, yang mewakili trend menaik atau menurun di pasaran.
- Kemas Kini Dinamik 🔄
-
- Penunjuk mengemas kini secara automatik dengan setiap bar baru, mengira semula dan melukis semula tahap sokongan dan rintangan berdasarkan tingkah laku harga terkini.
Bagaimana Algoritma Ini Membantu Pedagang? 💡
Algoritma ini adalah pengubah permainan untuk pedagang kerana:
- Menyediakan Pandangan Makro Pasaran 🌐
-
- Dengan melukis saluran serong, algoritma menunjukkan trend utama pasaran, membantu pedagang mengenal pasti sama ada harga berada dalam trend menaik 📈, trend menurun 📉, atau pergerakan mendatar ↔️.
- Mengenal Pasti Kawasan Sokongan dan Rintangan Utama 🎯
-
- Tahap sokongan dan rintangan adalah zon di mana harga mungkin memantul atau pecah. Tahap ini berguna untuk:
-
- Menetapkan titik masuk dan keluar untuk perdagangan.
- Meletakkan stop-loss 🛑 dan take-profit ✅ pesanan.
- Mengenal pasti pecahan 🚀 atau pembalikan 🔄 dalam harga.
- Mempermudah Analisis Teknikal 🕒
-
- Algoritma mengautomatikkan proses mengenal pasti sokongan dan rintangan, menjimatkan masa bagi pedagang yang melakukan analisis manual.
- Dengan memaparkan tahap dan saluran dengan jelas, ia membantu pedagang membuat keputusan yang lebih bermaklumat.
- Boleh Disesuaikan 🎨
-
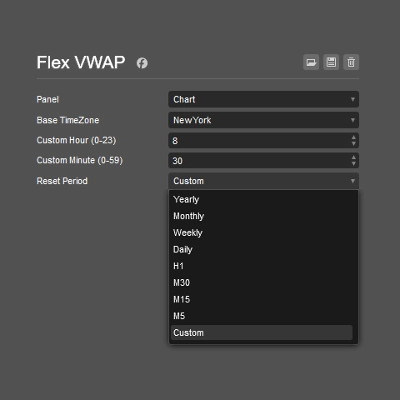
- Pedagang boleh melaraskan parameter seperti bilangan bar sejarah yang dianalisis, ketebalan garis, dan warna, membolehkan penunjuk disesuaikan dengan gaya perdagangan dan keutamaan visual yang berbeza.
Contoh Praktikal 📌
Bayangkan anda sedang menganalisis carta harga, dan algoritma telah melukis:
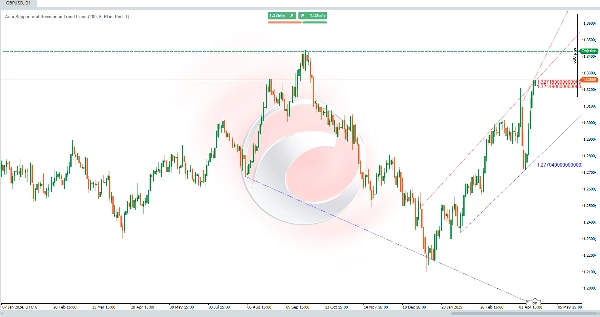
- Satu garis sokongan serong ↗️ yang menghubungkan beberapa rendah tempatan, menunjukkan trend menaik.
- Satu garis rintangan serong ↗️ yang menghubungkan beberapa tinggi tempatan, menunjukkan saluran menaik.
- Beberapa garis mendatar yang mewakili tahap sokongan dan rintangan utama.
Dengan maklumat ini, anda boleh:
- Mengenal pasti bahawa harga berada dalam trend menaik 📈.
- Mencari peluang membeli dekat garis sokongan serong atau tahap sokongan mendatar.
- Menetapkan stop-loss 🛑 di bawah tahap sokongan terdekat.
- Memerhati sama ada harga memecah rintangan untuk mengesahkan kesinambungan trend atau kemungkinan pembalikan 🔄.
Ringkasan
Once validated, support and resistance levels are drawn as horizontal or diagonal lines, and connected to form channels indicating bullish or bearish trends. The indicator updates dynamically with each new bar, recalculating and redrawing levels to reflect the most recent price behavior.
This tool aids traders by providing a macro view of market trends, identifying zones where price may bounce or break, and simplifying technical analysis through automation. It supports setting entry and exit points, stop-loss and take-profit orders, and spotting potential breakouts or reversals. Parameters such as the number of historical bars analyzed, line thickness, and colors can be customized to fit different trading styles and preferences.


![Logo "High-Low Divergence [Iridio Capital]"](https://cdn.ctrader.com/image/webp/443c4661-7abb-40f1-842f-4b6ec560649b_40914)


![Logo "[Hamster-Coder] Moving Average MTF"](https://cdn.ctrader.com/image/webp/b11b98b1-194d-4b8e-b00e-d611826ad159_31226)