
Descrição
Pinescritlabs
Indicadores da Ctrader Store: 🤖cBots da Pinescritlabs Ctrader Store:
Fair Value Gap Sessions Gold & BTC Breakout Session Pivots
Dynamic Market Structure
Análise de Pontos de Virada
Fibonacci Linear
Regressão Multi-temporal
Gradiente de Tendência Dinâmico
Viés de Velas Multi-Nível
Rastreador
Rastreador de Extremos Zig-Zag
Linhas de Tendência de Suporte e
Resistência Automáticas
Todos os Níveis de Suporte e
Resistência
Mapa de Liquidação de Alavancagem
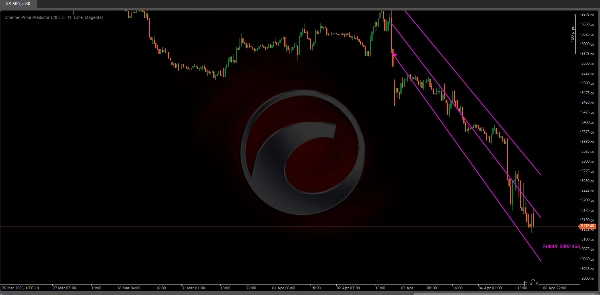
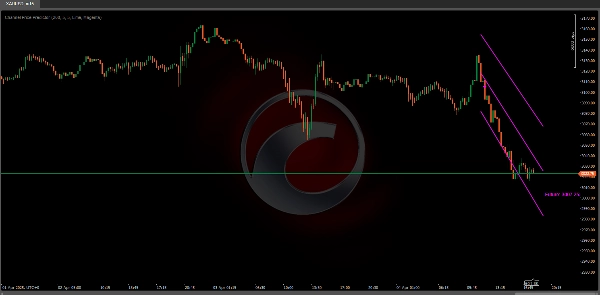
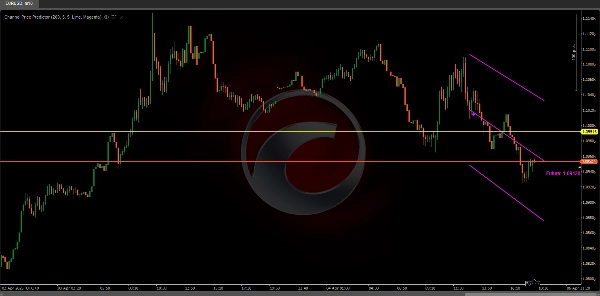
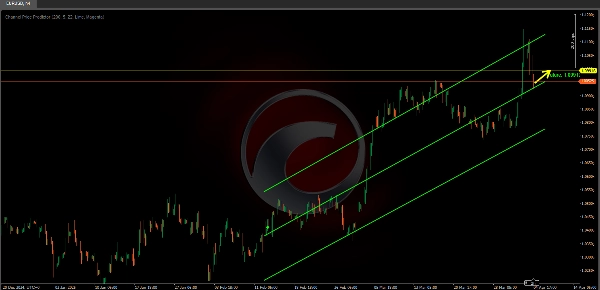
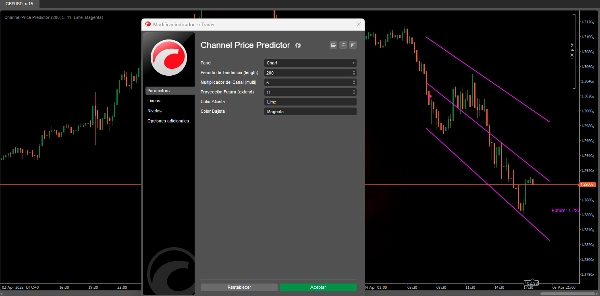
O Previsor de Preço do Canal identifica e desenha um canal de tendência (seja altista ou baixista) no gráfico, estendendo-o para o futuro para antecipar possíveis zonas de preço. 📈🔮
O canal é baseado no ATR (Average True Range), que mede a volatilidade do mercado. Quanto maior a volatilidade recente, mais amplo o canal, ajudando a visualizar a faixa de movimentos prováveis. 📊💥
Ele identifica e desenha automaticamente os canais com base nos pivôs altos e baixos.
Opção para estender as linhas do canal e projetar seu preço futuro. 🕒📉
Este canal não apenas mostra o movimento atual, mas também fornece uma projeção estimada de preço para o futuro através de um rótulo (“Futuro: …”) indicando o possível valor do preço. 📅💡
Para que serve?
Identificação de Tendência:
O indicador usa uma lógica interna para detectar quando o mercado muda de altista para baixista (ou vice-versa). Dessa forma, você pode visualizar mais claramente se o ativo está em uma fase de alta ou de baixa. 📈🔄📉
Canais de Volatilidade:
O canal é baseado no ATR (Average True Range), que mede a volatilidade. Quanto maior a volatilidade recente, mais amplo o canal. Isso ajuda você a ver a faixa de movimentos prováveis. 📊🔍
Projeção Futura:
O indicador não mostra apenas a tendência atual, mas estende o canal alguns períodos à frente (configurável), para que você possa antecipar possíveis zonas de suporte/resistência dentro dessa tendência. ⏳🚀
Permite estender as linhas do canal e projetar seu preço futuro. ⬆️⬇️
Referências de Preço:
Ao desenhar a linha central e as bordas superior e inferior, ele fornece referências para colocar seus stops, alvos ou mesmo para gerenciar entradas/saídas com mais informações sobre volatilidade. 🎯📍
Devido às limitações do cTrader, atualmente não é possível rolar para a direita no gráfico para visualizar adequadamente as extensões futuras do canal.
Recomenda-se definir o parâmetro “Projeção Futura” para um valor inferior a 25 períodos para evitar problemas de exibição.
Assim que o cTrader implementar a capacidade de estender o gráfico para o futuro, faremos melhorias no algoritmo para aproveitar totalmente essa funcionalidade.
Resumo
Key features include automatic detection of trend direction changes, visualization of current trend channels, and the ability to extend channel lines into the future. This future projection helps anticipate potential support and resistance zones by displaying estimated price values labeled as “Future: …”. The indicator draws a central line along with upper and lower channel boundaries, providing reference points for placing stops, targets, and managing trade entries and exits with volatility context.
Users can configure the number of periods for future projection, with a recommended maximum of 25 periods to avoid display issues due to cTrader platform limitations. The indicator supports analysis of various markets including cryptocurrencies (e.g., BTCUSD), commodities (e.g., XAUUSD), and others where volatility and trend identification are relevant.
Avaliações de clientes
5 | 100 % | |
4 | 0 % | |
3 | 0 % | |
2 | 0 % | |
1 | 0 % |


