الوصف
الوصف
مؤشرات متجر Pinescriptlabs: 🤖متجر Pinescriptlabs cBots :
ICT Power of 3 (cBot) اختراق الذهب و BTCمحاور الجلسة(جديد)YieldShield"
خطوط دعم ومقاومة SmartTrend
Resistance Lines
هيكل السوق الديناميكي
تحليل نقاط التحول
فيبوناتشي الخطي
انحدار متعدد الأطر الزمنية
تحيز الشمعة متعدد المستويات
المتعقب
الدعم التلقائي و
خطوط اتجاه المقاومة
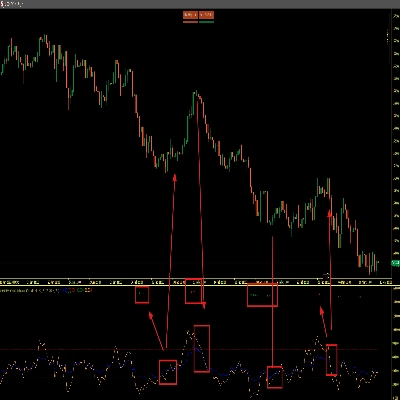
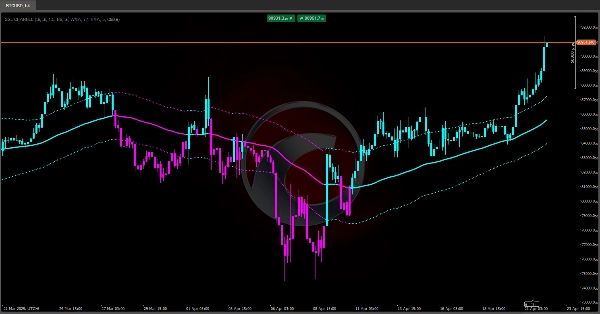
قناة SSL المميزة 🔍
يجمع بين كشف الاتجاه عبر المتوسط المتحرك، تقييم التقلب بواسطة نطاقات تعتمد على ATR، و مرشح قصير الأجل (SSL) لتقديم نظام تحليل متكامل. 💡 تكمن قوته في وضوح إشاراته البصرية وقدرته على التكيف عبر الأسواق، بينما التحدي الرئيسي هو تقليل التأخير وتصفيه الحركات الجانبية. مع التهيئة المناسبة، يصبح أداة قوية للقرارات الدخول/الخروج في التداول. 🎯
1. الغرض وفائدة التداول 📊
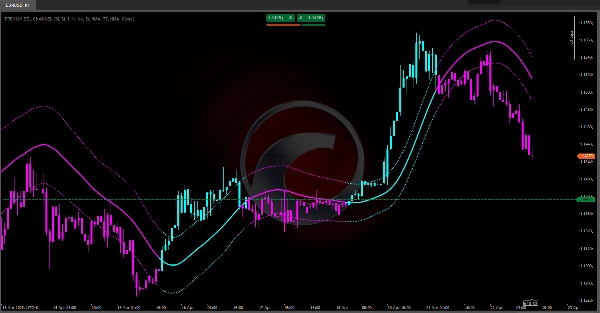
• كشف الاتجاه الرئيسي: بفضل خط مركزي (الخط الأساسي)، يعرض المؤشر اتجاه السوق السائد. 📈📉
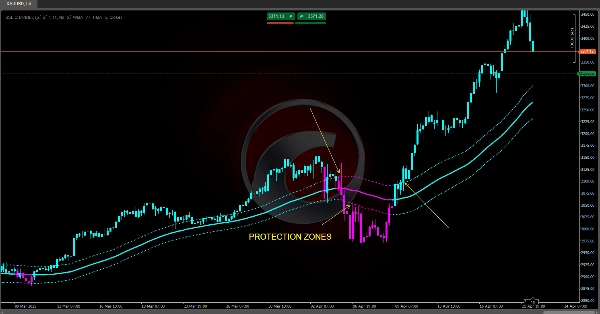
• قياس التقلب: باستخدام متوسط النطاق (ATR)، يضبط نطاقين (فوق/تحت الخط الأساسي) كمناطق دعم/مقاومة ديناميكية. ⚡
• مرشح الضوضاء وتحول التحيز: قناة SSL (متوسط متحرك تكيفي يعتمد على القمم/القيعان) تحدد الانعكاسات قصيرة الأجل لدخول/خروج دقيق. 🔄
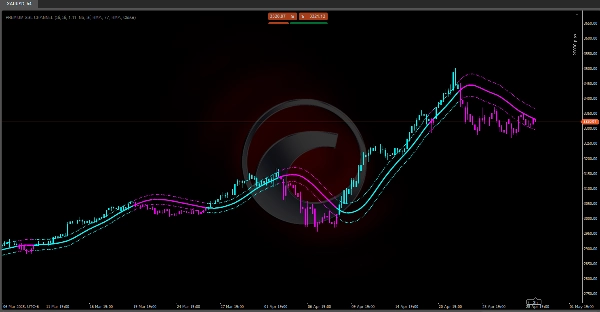
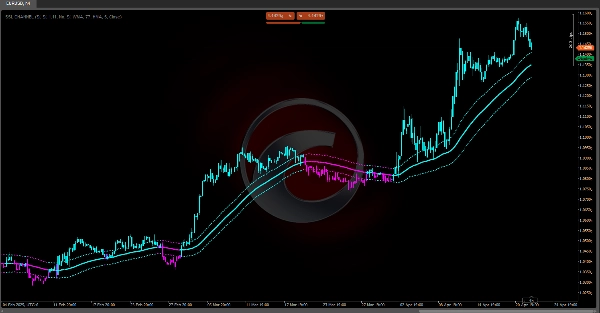
• تصور بديهي: تلون أشرطة السعر والخطوط حسب التحيز (سماوي = صاعد، أرجواني = هابط) للتفسير الفوري. 🎨
2. المكونات الأساسية والمنطق ⚙️
2.1. الخط المركزي ("الخط الأساسي")
• يحسب متوسط سعر متحرك (SMA، EMA، WMA، أو Hull) لتنعيم الضوضاء.
• يمثل القيمة المتوسطة للسوق، مظهراً الاتجاه السائد:
- السعر فوق → اتجاه صاعد. 🟢
- السعر تحت → اتجاه هابط. 🔴
2.2. متوسط النطاق (ATR)
• يقيس تقلب السوق الحقيقي من خلال متوسط القمم/القيعان/الإغلاقات السابقة.
• ATR الأعلى = مزيد من التقلب؛ ATR الأقل = أسواق أكثر هدوءًا. 🌊
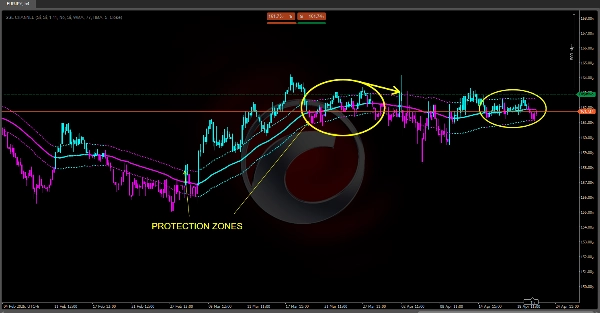
2.3. النطاقات الديناميكية ("ATR العلوي" و "ATR السفلي")
• ATR العلوي = الخط الأساسي + (ATR × المضاعف)
• ATR السفلي = الخط الأساسي – (ATR × المضاعف)
• يعمل كنطاقات سعرية:
- السعر يلامس النطاق العلوي → قوة صاعدة. 🚀
- السعر قريب من النطاق السفلي → زخم هابط. 🐻
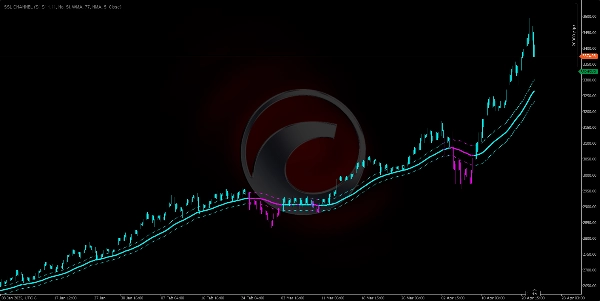
2.4. قناة SSL (خط الإشارة الملساء)
• تستخدم المتوسطات المتحركة على القمم والقيعان بشكل منفصل.
• منطق الاتجاه:
- الإغلاق فوق متوسط القمم → تحيز صاعد. ✅
- الإغلاق تحت متوسط القيعان → تحيز هابط. ❌
- في المنتصف → يستمر التحيز السابق.
• يعمل كـ مرشح اتجاه قصير الأجل، يؤكد أو يناقض الخط الأساسي. 🔄
3. توليد الإشارات والاستخدام العملي 🛠️
1. تأكيد الاتجاه
- صعودي قوي: السعر > ATR العلوي. 🟢
- صعودي معتدل: ATR العلوي > السعر > الخط الأساسي.
- هبوطي معتدل: الخط الأساسي > السعر > ATR السفلي.
- هبوطي قوي: السعر < ATR السفلي. 🔴
2. مرشح SSL
- الدخول: الدخول في صفقات شراء فقط إذا كان SSL فوق خطه (أو بيع إذا كان تحته). ⬆⬇
- الخروج: خروج جزئي/كلي عند انعكاس SSL وعبوره فوق/تحت المتوسط المتحرك المقابل. ✋
3. تلوين الأشرطة
- تتحول أشرطة السعر إلى السماوي (صاعد) أو الأرجواني (هابط)، متزامنة مع الخط الأساسي لقراءة سريعة للسوق. 🎨
4. المعلمات القابلة للتكوين والتأثير ⚖️
• فترة الخط الأساسي: الأطول = أكثر سلاسة لكن بطيء؛ الأقصر = أكثر استجابة لكن صاخب. 🐢⚡
• مضاعف النطاق: الأعلى = قناة أوسع (إشارات خاطئة أقل)؛ الأقل = أضيق (إشارات أكثر، تقلبات أكثر). ↔️
• نوع المتوسط المتحرك (SMA/EMA/WMA/HMA): يؤثر على وزن الأسعار الحديثة مقابل التاريخية. 📅
• فترة ونوع SSL: يحدد حساسية المرشح قصير الأجل. 🎚️
الملخص
تقييمات العملاء
5 | 100 % | |
4 | 0 % | |
3 | 0 % | |
2 | 0 % | |
1 | 0 % |