Descrizione
L'AdaptiveTrendChannel è un indicatore che ti aiuta a visualizzare le tendenze di mercato in modo più chiaro e dinamico. 📈 A differenza di una media mobile normale, si adatta in tempo reale mentre il prezzo evolve, permettendoti di vedere quando la tendenza sta cambiando. 🔄
🛠️ Come Funziona?
La prima cosa che fa è generare una linea di riferimento dinamica che si aggiorna ad ogni candela. 🕯️ Considera questa linea come un punto di equilibrio, che ti indica se il prezzo si trova in una zona di equilibrio o si muove in una direzione chiara.
Ma questa linea non funziona da sola! Si basa anche su livelli interni che fungono da supporti e resistenze dinamici. 💪 Questi livelli si adattano costantemente in base ai recenti massimi e minimi 📉📈, il che significa che non sono fissi—si adattano alle condizioni di mercato in tempo reale.
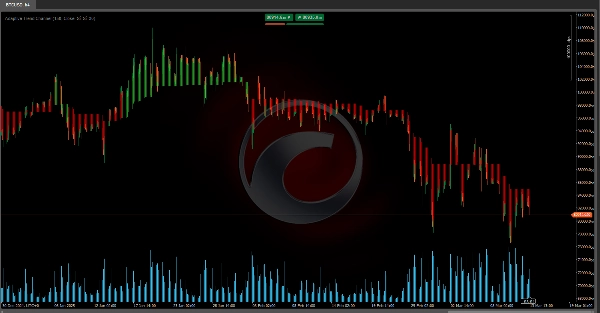
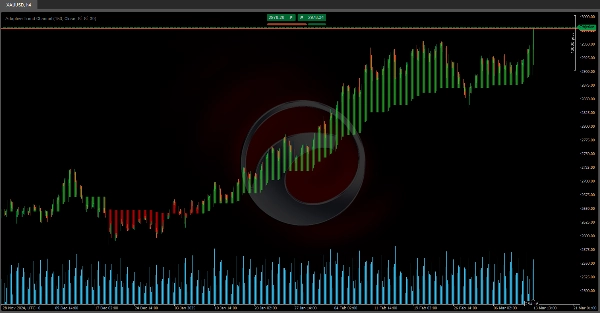
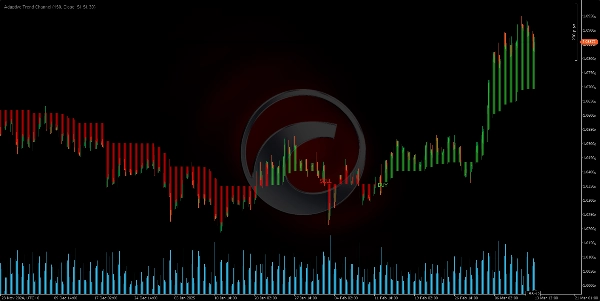
Quando il prezzo si muove sopra o sotto questi livelli dinamici, l'indicatore rileva un cambiamento di tendenza e genera segnali. Per rendere tutto ancora più chiaro, colora l'area tra la linea di riferimento e il prezzo di chiusura, rendendo le tendenze visivamente evidenti. 🎨👀
📌 Come Usarlo nel Trading?
Ora, come si applica questo nei trade reali? Facile.
✅ Se il prezzo rimane sopra la linea di riferimento per più candele, il mercato è considerato rialzista. 🟢
❌ Se il prezzo scende sotto la linea di riferimento, il mercato è considerato ribassista. 🔴
Poiché questa linea si adatta dinamicamente e filtra il rumore di mercato, ti offre una visione più pulita della tendenza.
Inoltre, l'indicatore monitora i recenti incroci:
🔻 Se il prezzo attraversa verso il basso un livello interno chiave, segnala una potenziale fase ribassista.
🔺 Se il prezzo attraversa verso l'alto un livello interno chiave, segnala una potenziale fase rialzista.
Con queste informazioni, l'indicatore fa due cose chiave:
🎨 Cambia il colore della linea e dell'area del grafico, fornendoti un segnale visivo immediato sulla direzione della tendenza.
📢 Genera segnali di acquisto/vendita quando viene rilevato un cambiamento di tendenza.
🔥 Perché È Così Potente?
L'AdaptiveTrendChannel ti aiuta a rimanere dalla parte giusta della tendenza ed evitare di operare contro il momentum del mercato. Evidenzia momenti chiave per punti di entrata e uscita, offrendoti un riferimento visivo chiaro per decisioni di trading più intelligenti.
Quando combinato con altri strumenti come l'analisi del volume o l'azione del prezzo, diventa un alleato potente per filtrare i trade e migliorare la precisione di entrata. 🚀💰
Indicatori del Ctrader Store:
Dynamic Market Structure
Analysis of Turning Points
Fibonacci Linear
Regression Multi-timeframe
Multi-Level Candle Bias
Tracker
Auto Support and
Resistance Trend Lines
All Support and
Resistance Levels
Riepilogo
When the price moves above or below these adaptive levels, the indicator detects trend changes and produces buy or sell signals. It visually highlights trends by coloring the area between the reference line and the closing price, providing clear visual cues on trend direction. Traders can interpret price staying above the reference line as bullish and below it as bearish, with the indicator filtering out market noise for a cleaner trend view.
Additionally, the Adaptive Trend Channel tracks recent crossovers of key internal levels to signal potential bullish or bearish phases. It is intended to help traders stay aligned with market momentum and identify key entry and exit points. When combined with other tools like volume analysis or price action, it supports improved trade filtering and entry precision.
Recensioni dei clienti
5 | 100 % | |
4 | 0 % | |
3 | 0 % | |
2 | 0 % | |
1 | 0 % |