
الوصف
Pinescritlabs
مؤشرات متجر Ctrader: 🤖روبوتات Pinescritlabs لمتجر Ctrader:
جلسات فجوة القيمة العادلة جلسات اختراق الذهب و BTC المحورية(جديد)
هيكل السوق الديناميكي
تحليل نقاط التحول
فيبوناتشي الخطي
انحدار متعدد الأطر الزمنية
انحياز الشمعة متعدد المستويات
المتعقب
دعم ومقاومة تلقائيان
خطوط اتجاه المقاومة
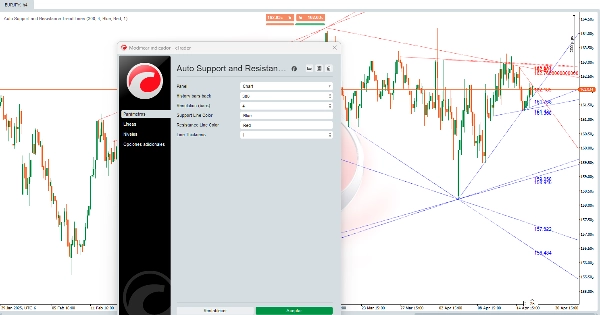
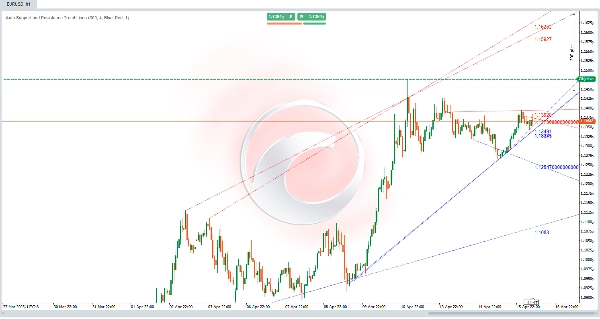
خطوط اتجاه الدعم والمقاومة التلقائية:
هذه الخوارزمية هي أداة قوية 🛠️ مصممة لـتحديد مستويات الدعم والمقاومة تلقائيًا على مخطط السعر. فهي لا ترسم فقط خطوط أفقية، بل تتبع أيضًا قنوات مائلة ↗️↘️ تمثل اتجاهات السوق. هذه المستويات والقنوات هي مناطق رئيسية حيث واجه السعر صعوبة في الارتفاع (مقاومة 🚧) أو الانخفاض (دعم 🛡️)، مما يجعلها نقاط حاسمة للقرارات التداولية. 📈📉
كيف تتم الحسابات؟ 🔍
تستخدم الخوارزمية نهج تحليل تاريخ السعر 📊 لتحديد مستويات الدعم والمقاومة. إليك كيف تعمل:
- تحديد القيعان والقمم المحلية ⬇️⬆️
-
- تحلل الخوارزمية السعر خلال نطاق معين من الأعمدة (الشموع) للعثور على القيعان المحلية (أدنى الأسعار في ذلك النطاق) والقمم المحلية (أعلى الأسعار في ذلك النطاق).
- هذه القيعان والقمم المحلية هي مرشحين محتملين لتصبح مستويات دعم ومقاومة.
- التحقق من صحة المستويات ✔️
-
- بمجرد تحديد القيعان والقمم المحلية، تتحقق الخوارزمية مما إذا كانت هذه المستويات قد تم احترامها من قبل السعر في الماضي.
- إذا لمس السعر مستوى عدة مرات دون كسره بوضوح، يعتبر مستوى دعم أو مقاومة صالحًا.
- رسم الخطوط والقنوات ✏️
-
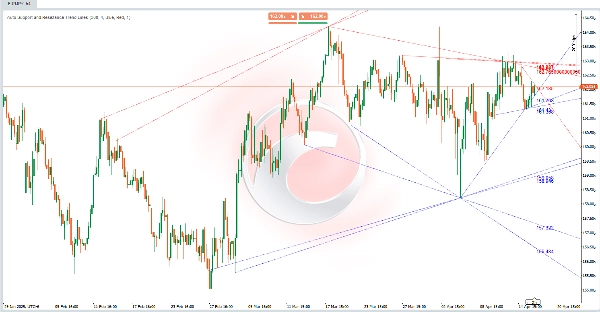
- ترسم مستويات الدعم كـخطوط أفقية (أو مائلة) عند القيعان المحلية التي تم التحقق منها.
- ترسم مستويات المقاومة كـخطوط أفقية (أو مائلة) عند القمم المحلية التي تم التحقق منها.
- بالإضافة إلى ذلك، تربط الخوارزمية هذه المستويات لتشكيلقنوات مائلة ↗️↘️، والتي تمثلاتجاهات صاعدة أو هابطة في السوق.
- تحديثات ديناميكية 🔄
-
- يقوم المؤشر بتحديث نفسه تلقائيًا مع كل عمود جديد، معيدًا حساب ورسم مستويات الدعم والمقاومة بناءً على سلوك السعر الأحدث.
كيف تساعد هذه الخوارزمية المتداولين؟ 💡
هذه الخوارزمية هي مغير لقواعد اللعبة للمتداولين لأنها:
- توفر رؤية شاملة للسوق 🌐
-
- من خلال رسم قنوات مائلة، تعرض الخوارزمية الاتجاهات الرئيسية للسوق، مما يساعد المتداولين على تحديد ما إذا كان السعر في اتجاه صاعد 📈، اتجاه هابط 📉، أو حركة جانبية ↔️.
- تحدد مناطق الدعم والمقاومة الرئيسية 🎯
-
- مستويات الدعم والمقاومة هي مناطق قد يرتد أو يكسر السعر عندها. هذه المستويات مفيدة لـ:
-
- تحديد نقاط الدخول والخروج للتداولات.
- وضع أوامر وقف الخسارة 🛑 وجني الأرباح ✅.
- تحديد الاختراقات 🚀 أو الانعكاسات 🔄 في السعر.
- يبسط التحليل الفني 🕒
-
- تقوم الخوارزمية بأتمتة عملية تحديد الدعم والمقاومة، مما يوفر الوقت للمتداولين الذين يقومون بالتحليل اليدوي.
- من خلال عرض المستويات والقنوات بوضوح، تساعد المتداولين على اتخاذ قرارات أكثر وعيًا.
- قابلة للتخصيص 🎨
-
- يمكن للمتداولين تعديل معايير مثل عدد الأعمدة التاريخية التي يتم تحليلها، سمك الخط، والألوان، مما يسمح بتكييف المؤشر مع أنماط التداول المختلفة والتفضيلات البصرية.
مثال عملي 📌
تخيل أنك تحلل مخطط سعر، وقد رسمت الخوارزمية:
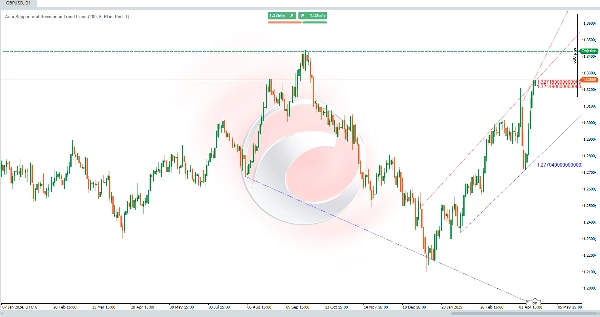
- خط دعم مائل ↗️ يربط عدة قيعان محلية، مما يشير إلى اتجاه صاعد.
- خط مقاومة مائل ↗️ يربط عدة قمم محلية، مما يظهر قناة صاعدة.
- عدة خطوط أفقية تمثل مستويات الدعم والمقاومة الرئيسية.
بهذه المعلومات، يمكنك:
- تحديد أن السعر في اتجاه صاعد 📈.
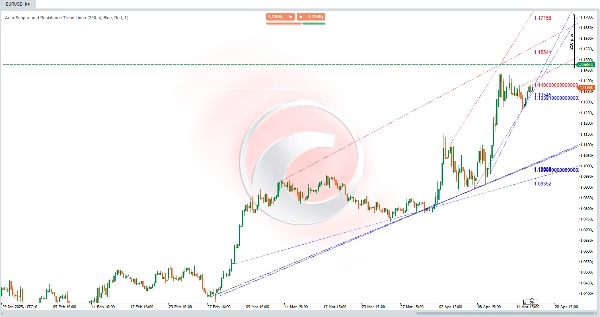
- البحث عن فرص شراء بالقرب من خط الدعم المائل أو مستويات الدعم الأفقية.
- تعيين وقف خسارة 🛑 أسفل أقرب مستوى دعم.
- مراقبة ما إذا كان السعر يكسر المقاومة لتأكيد استمرار الاتجاه أو احتمال انعكاس 🔄.
الملخص
Once validated, support and resistance levels are drawn as horizontal or diagonal lines, and connected to form channels indicating bullish or bearish trends. The indicator updates dynamically with each new bar, recalculating and redrawing levels to reflect the most recent price behavior.
This tool aids traders by providing a macro view of market trends, identifying zones where price may bounce or break, and simplifying technical analysis through automation. It supports setting entry and exit points, stop-loss and take-profit orders, and spotting potential breakouts or reversals. Parameters such as the number of historical bars analyzed, line thickness, and colors can be customized to fit different trading styles and preferences.


![شعار "[Stellar Strategies] Inside Bar with Signals"](https://cdn.ctrader.com/image/webp/1d9e8bfa-3b2c-4440-bb37-5856902008a7_30683)