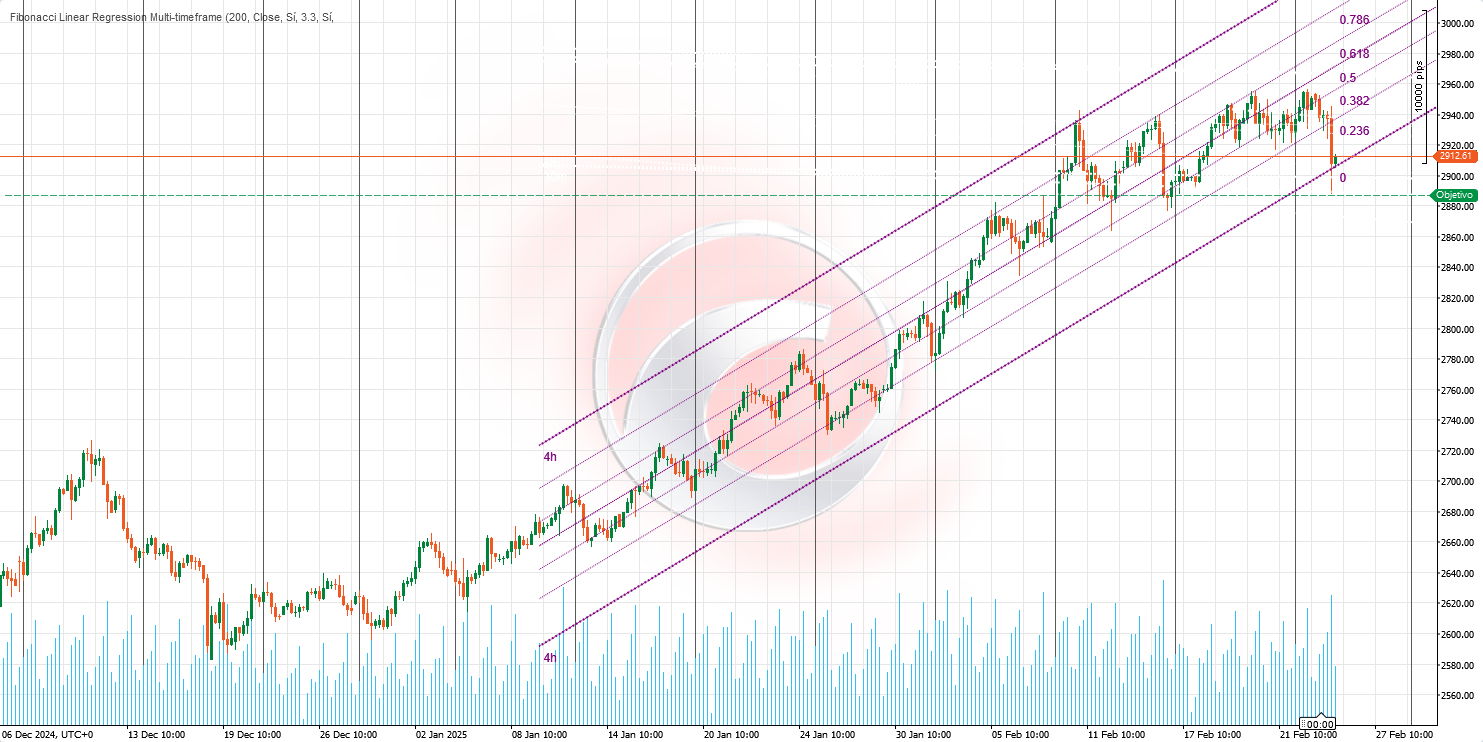
💡 Linear Regression Channels and ZigZag Points 💡
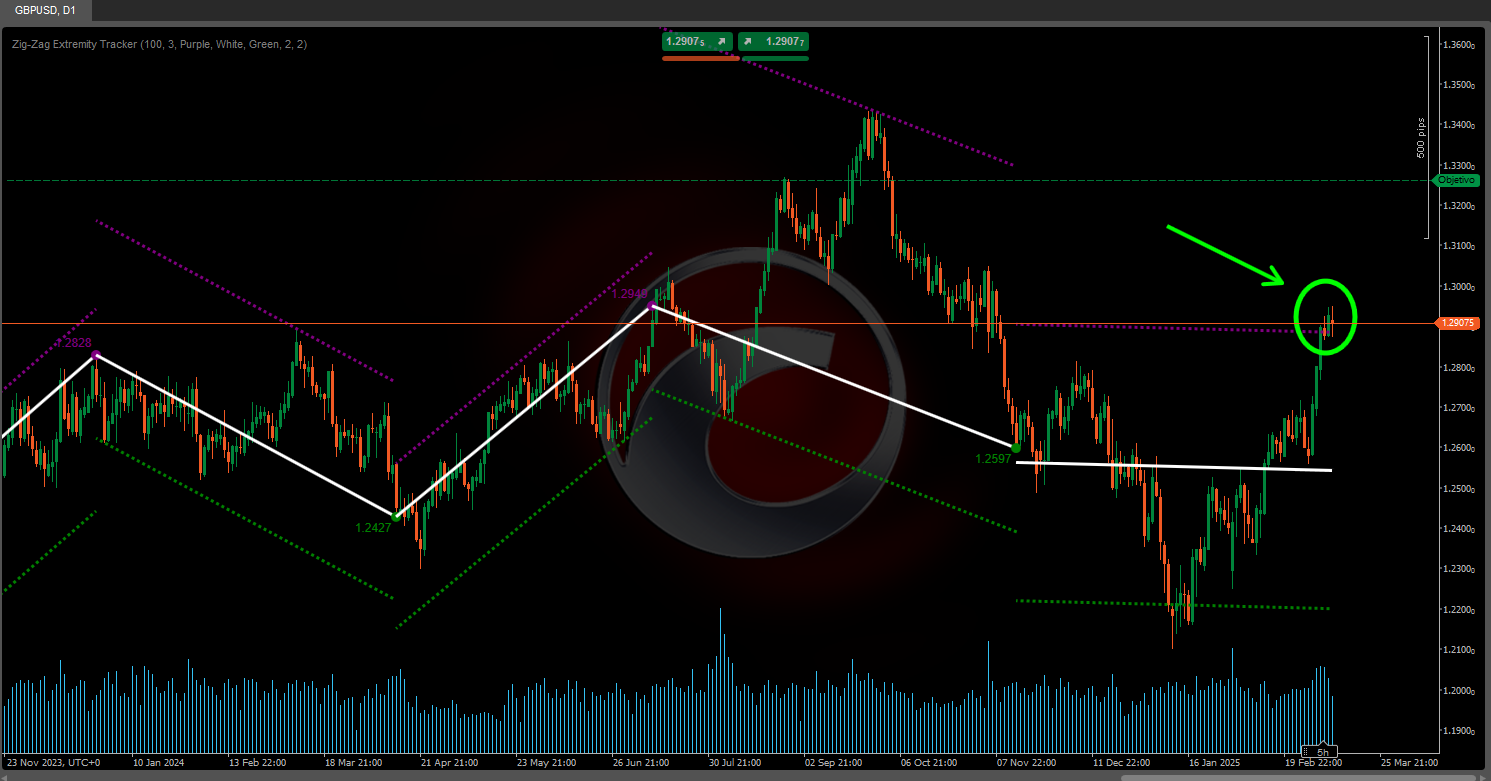
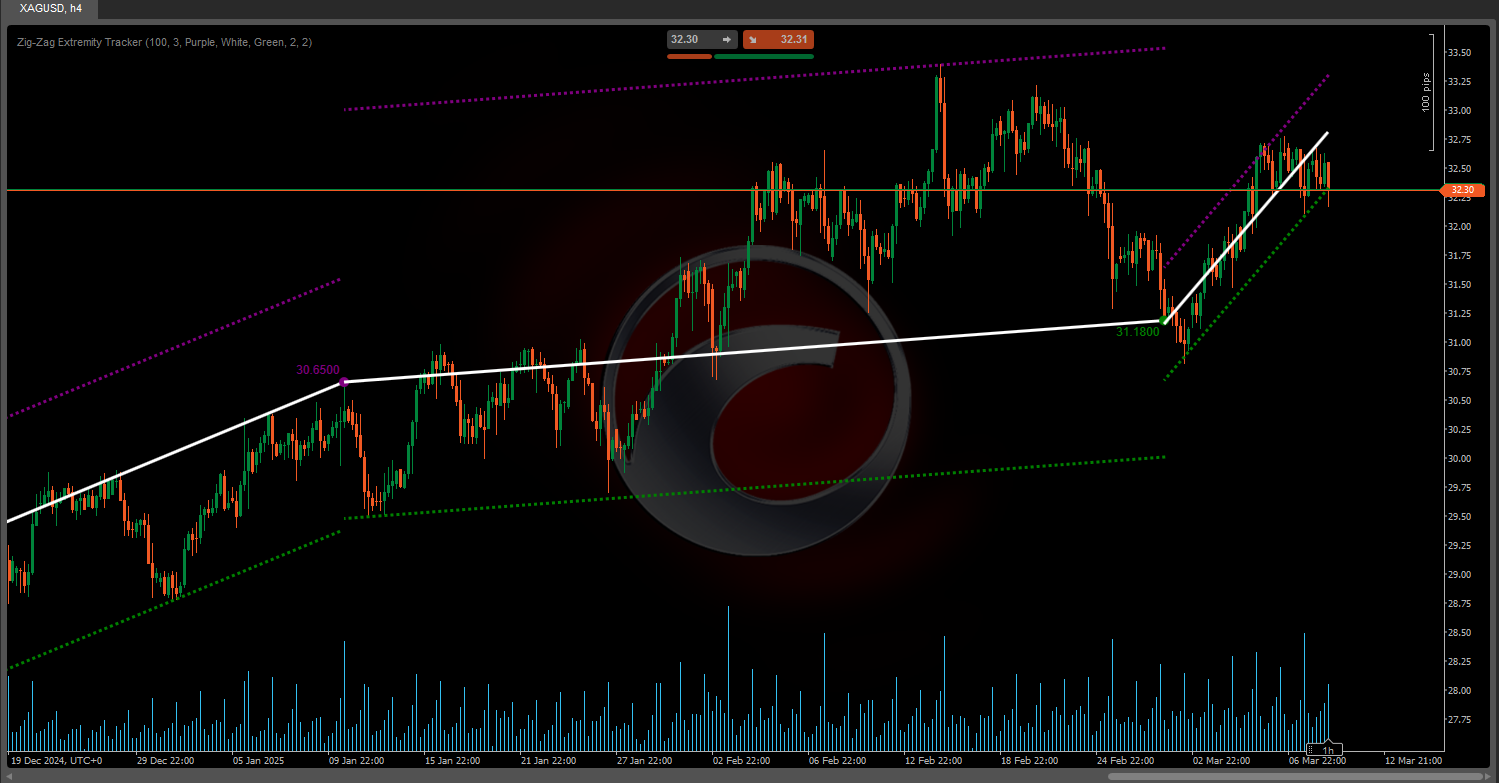
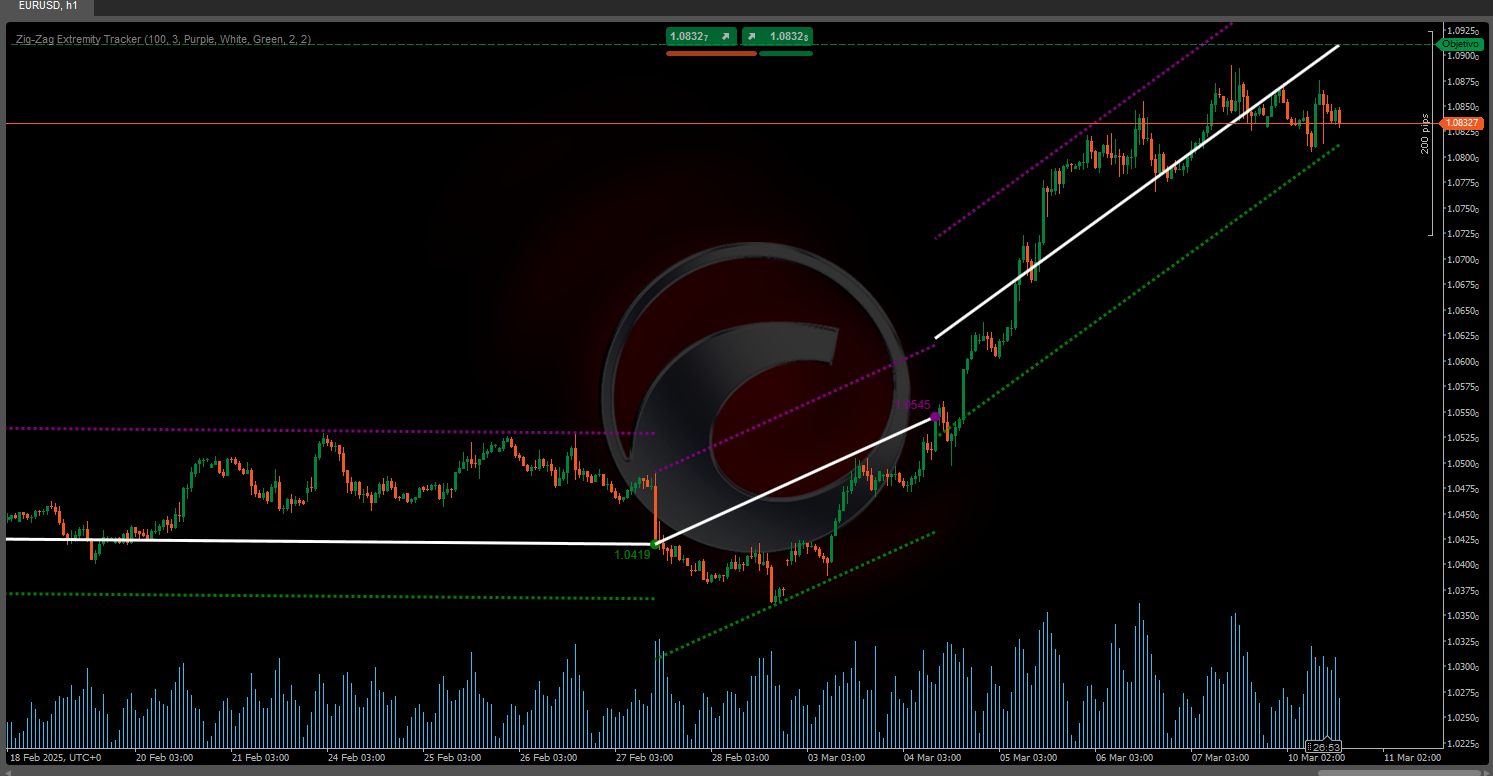
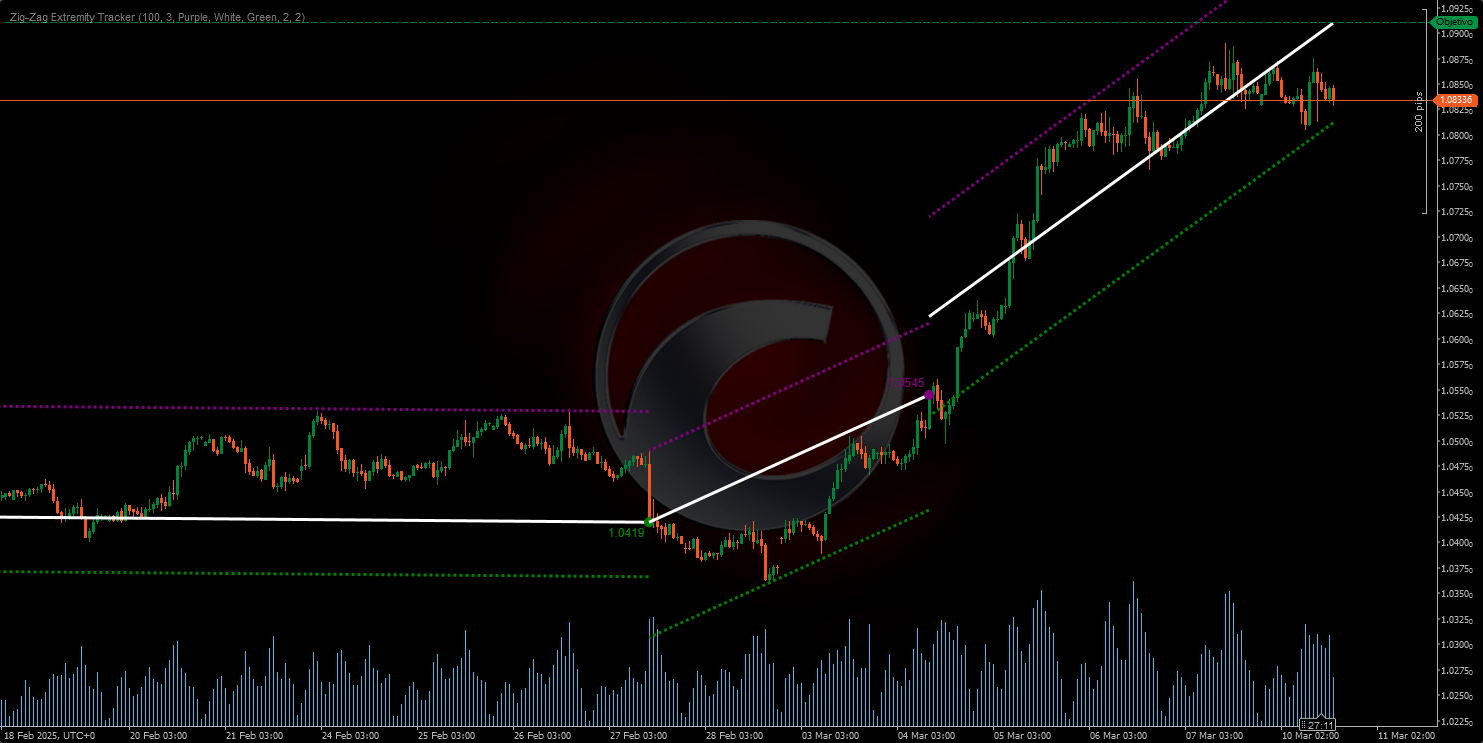
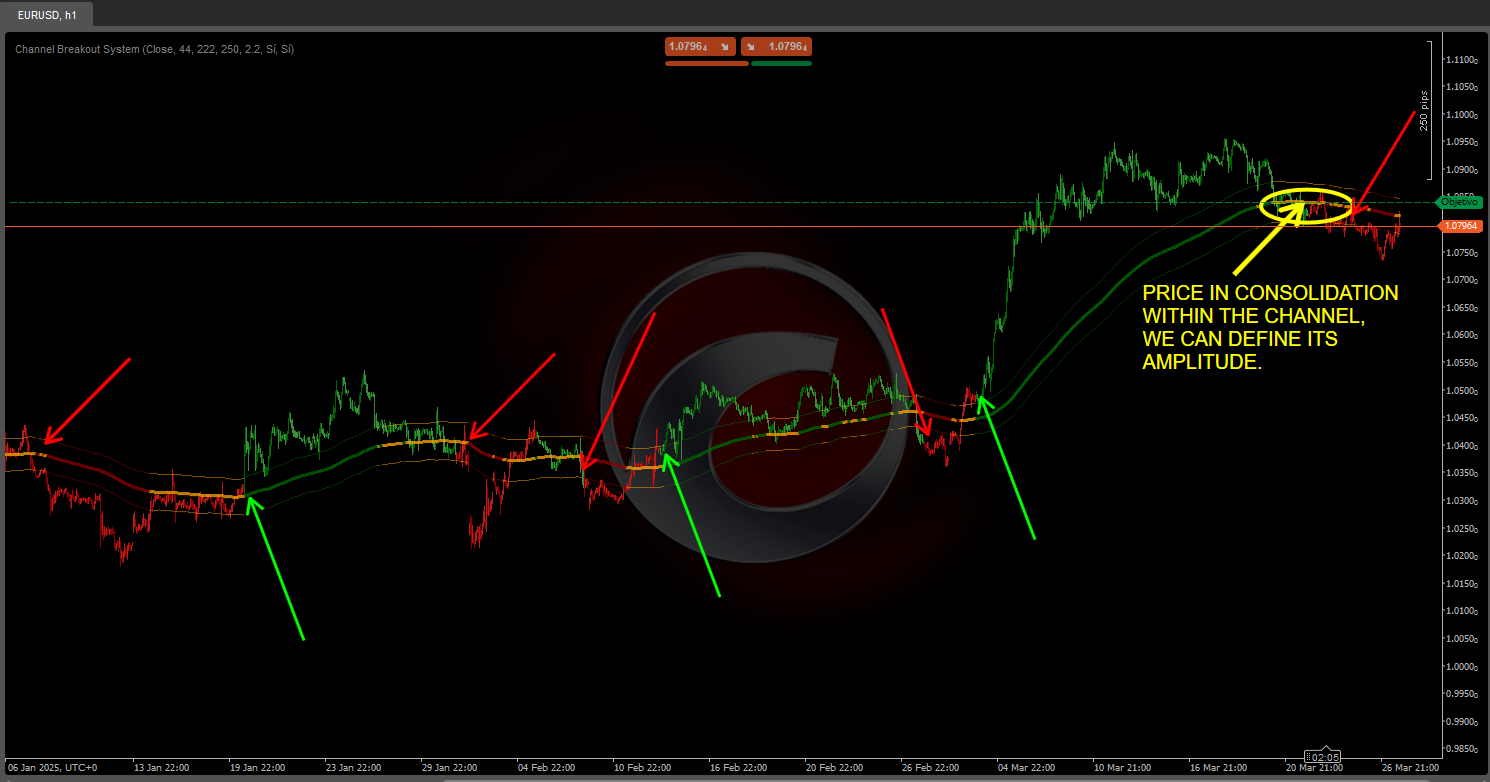
• The linear regression channels are recalculated and reset each time the price moves beyond the expected boundaries (bands), ensuring the measurement remains up-to-date with the market’s real trend.
• The marked points (circles) represent extremes (highs and lows) that serve as the basis for drawing the ZigZag and determining where the channels are calculated from.
• This dynamic approach allows for better visualization of potential trend changes, as well as areas of overextension or overselling where the price might revert toward the mean.
❓ How do the channels relate to the ZigZag and the extreme points? ❓
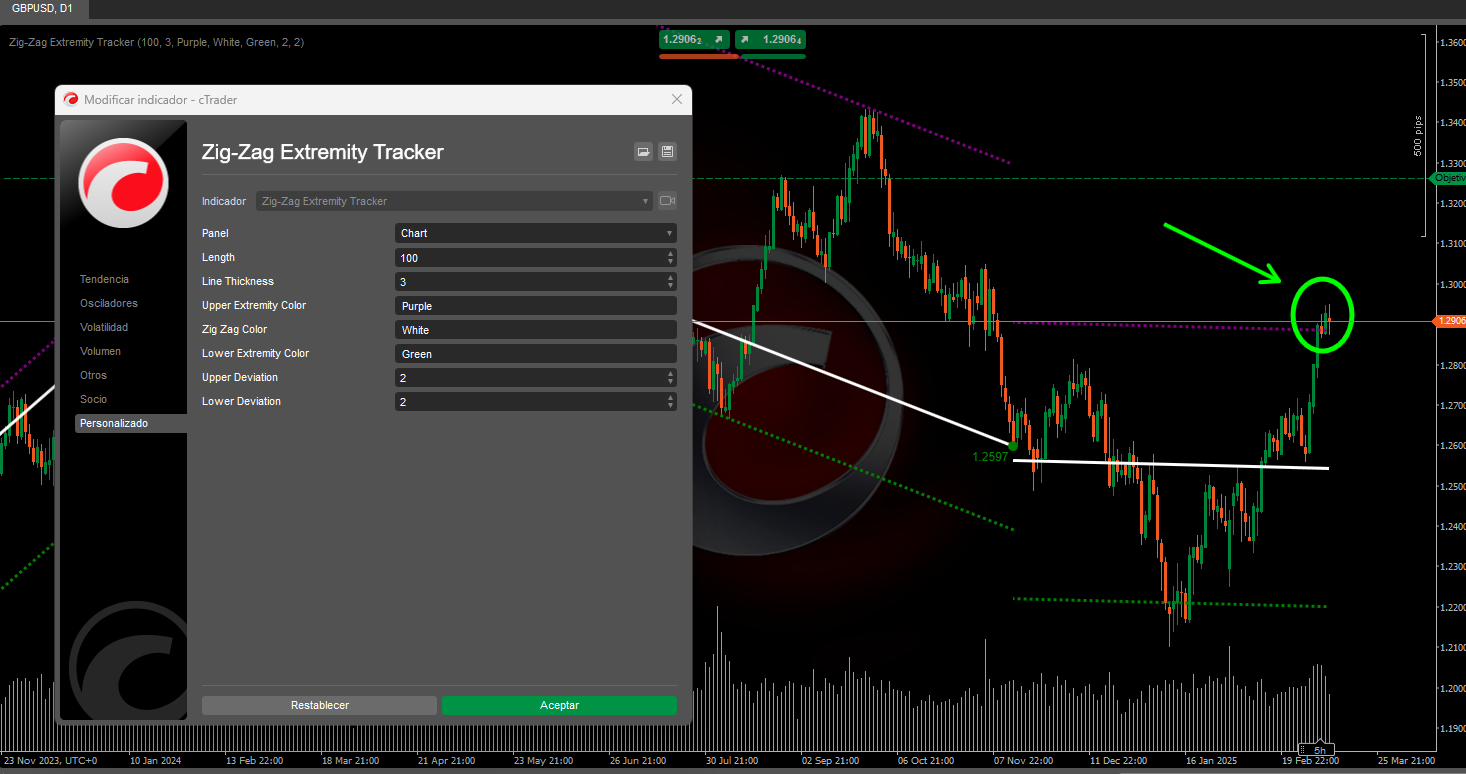
• Whenever a new extreme (high or low) is detected, the indicator not only plots a circle and the ZigZag line connecting that point to the previous one, but also readjusts the potential linear regression channel being drawn from that last extreme.
• If, during the following bars, the price remains within the bands, the channel stays active and extends to the current bar.
• If at any point the price breaks those bands, the indicator “assumes” the channel has been invalidated and starts a new one from the bar where the break occurred.
Ctrader Store indicators:
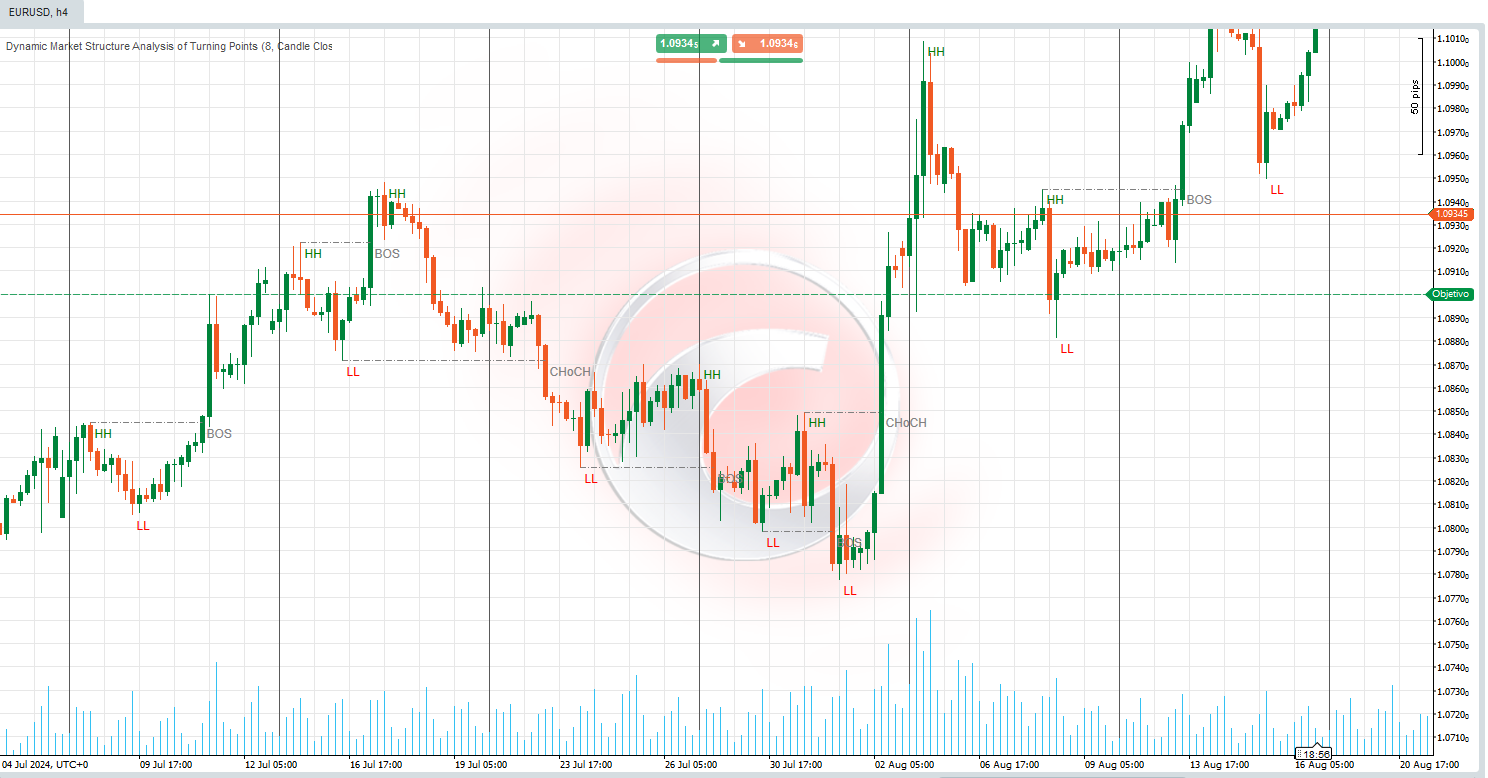
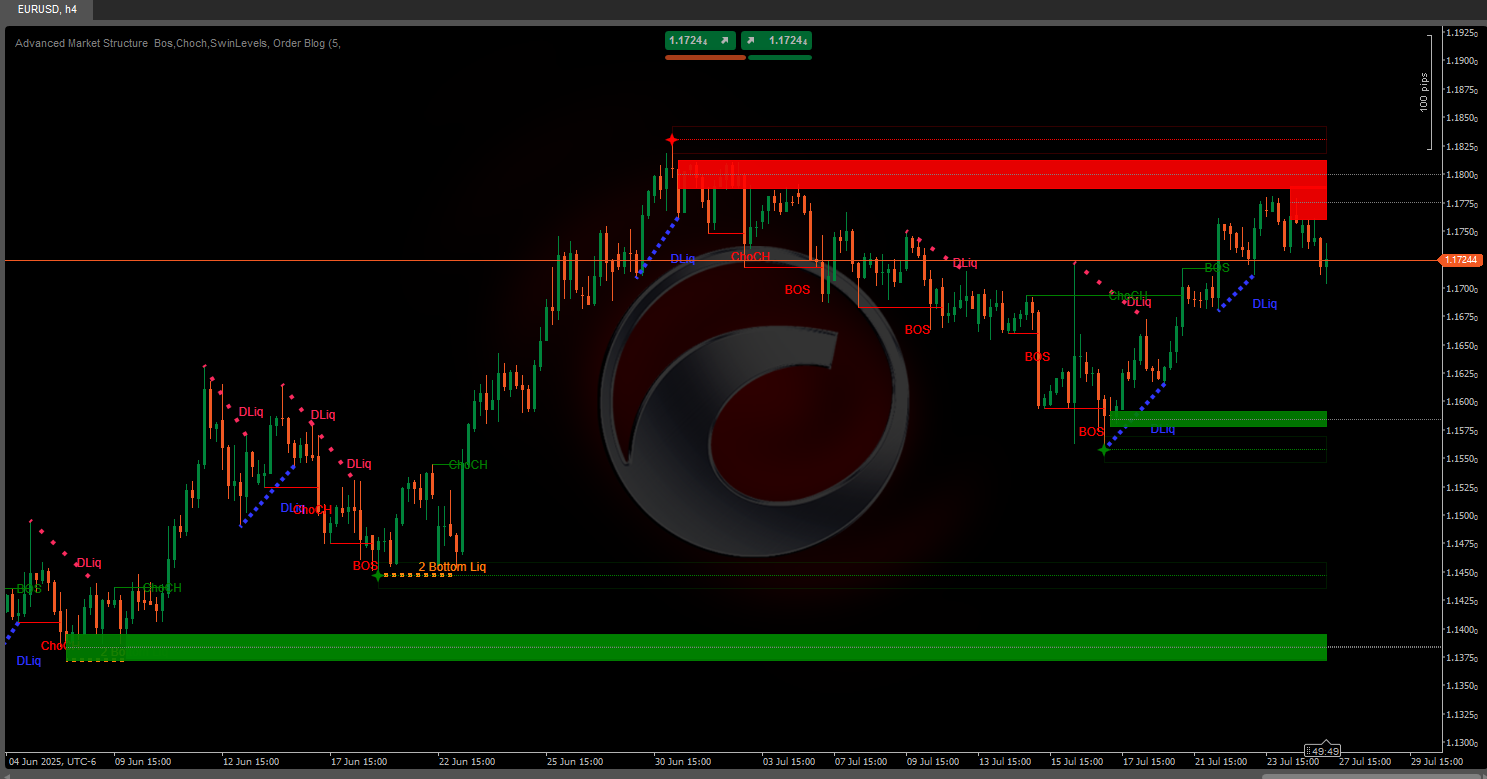
Dynamic Market Structure
Analysis of Turning Points
Fibonacci Linear
Regression Multi-timeframe
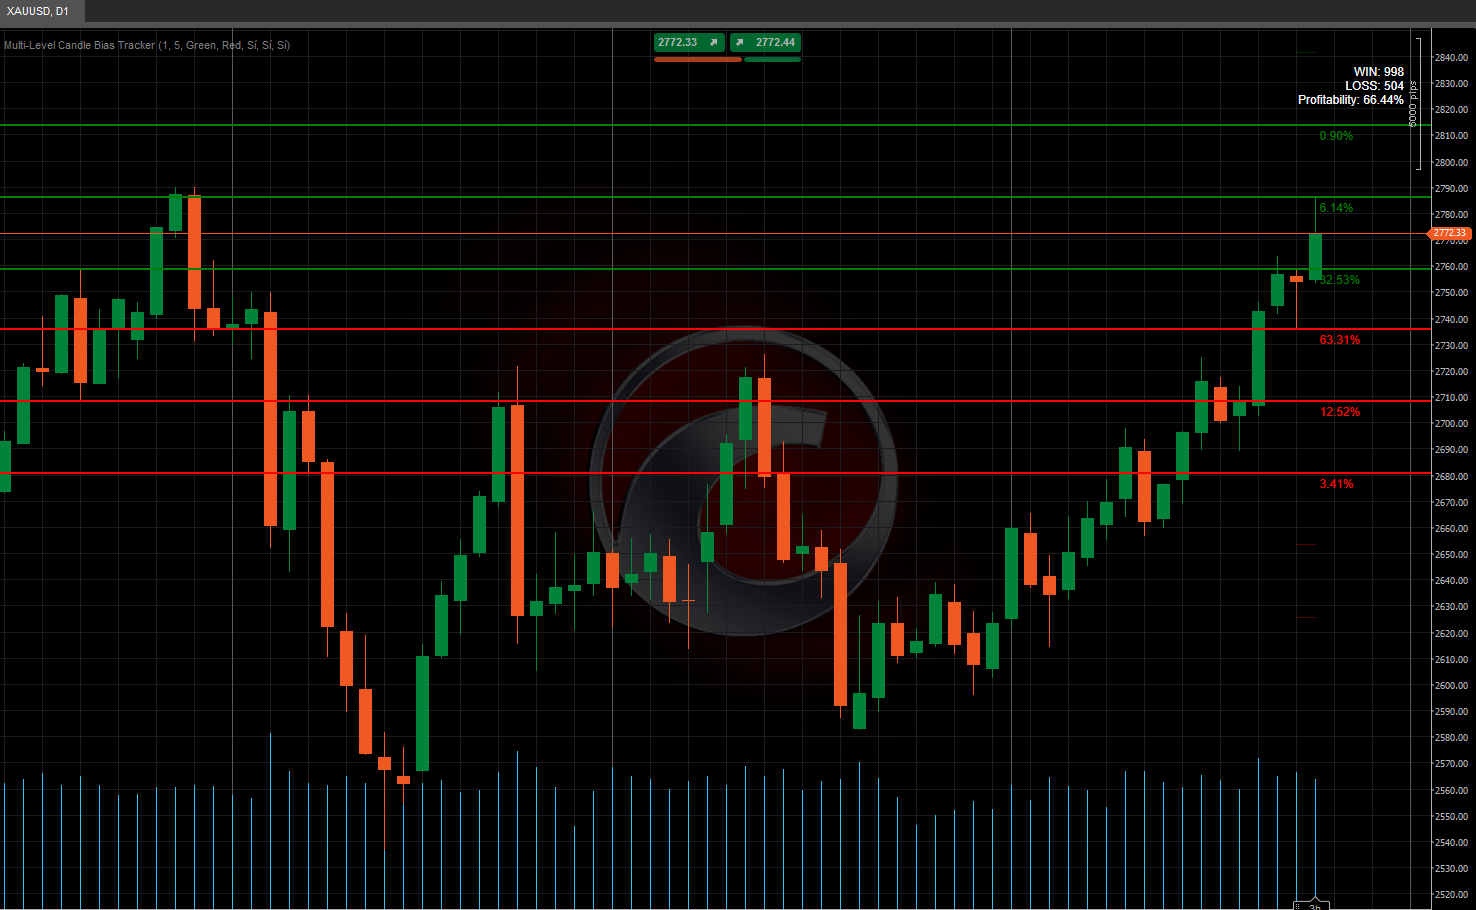
Multi-Level Candle Bias
Tracker
Auto Support and
Resistance Trend Lines
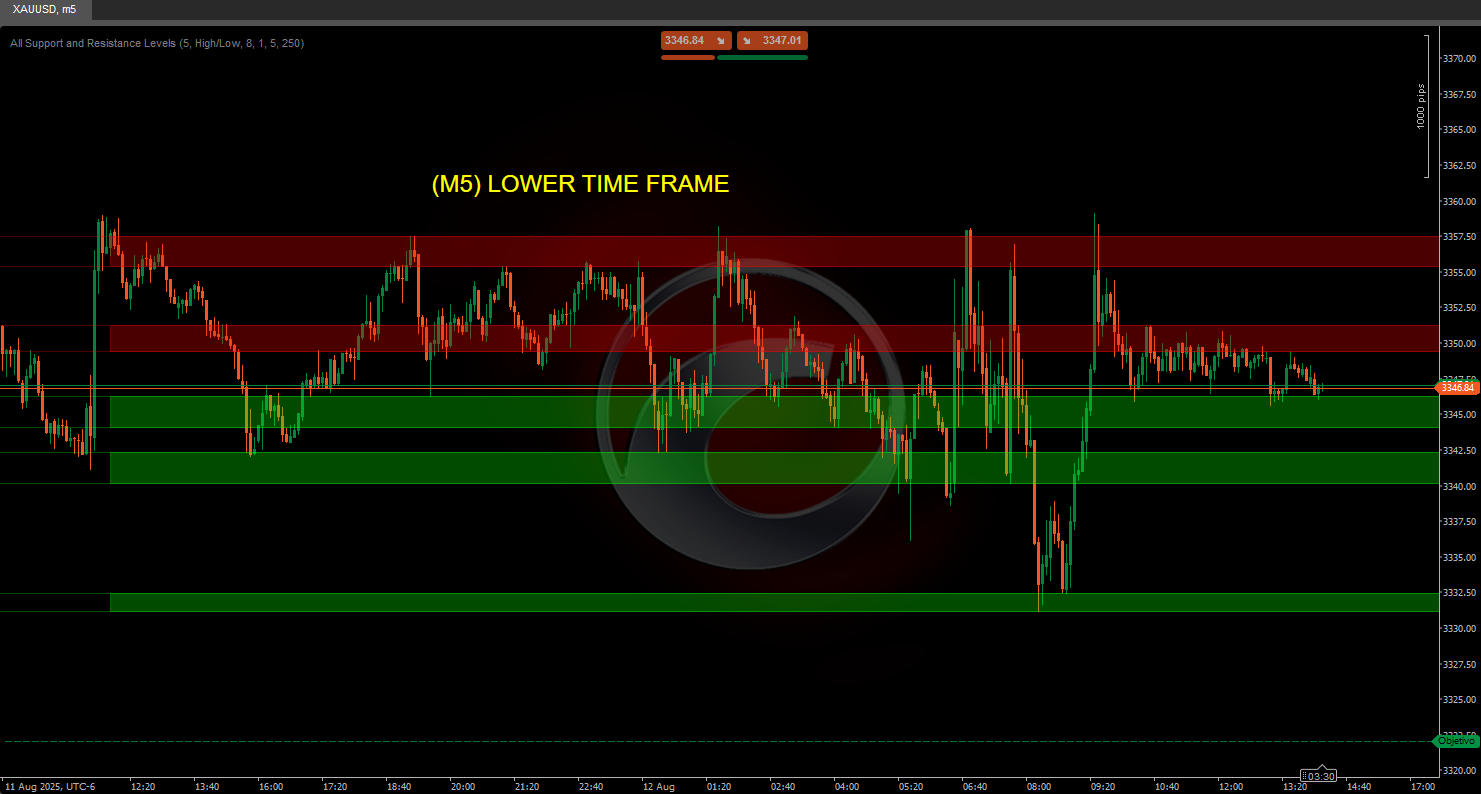
All Support and
Resistance Levels
Dynamic Market Structure Analysis of Turning Points
Fibonacci Linear Regression Multi-timeframe
Multi-Level Candle Bias Tracker
Auto Support and Resistance Trend Lines


!["[Stellar Strategies] Visual Trend Momentum" logo](https://market-prod-23f4d22-e289.s3.amazonaws.com/3835d044-1c21-4909-9d3c-2635f984b93d_visualtrendmomentum.jpg)
!["[Stellar Strategies] Moving Averages Combined 1.0" logo](https://market-prod-23f4d22-e289.s3.amazonaws.com/b4cd360c-5f3c-4902-b2e1-6b86da1199bb_Gemini_Generated_Image_nl1erpnl1erpnl1e.jpg)