Descripción
Pinescritlabs
Indicadores de Ctrader Store: 🤖cBots de Pinescritlabs Ctrader Store:
Fair Value Gap Sessions Gold & BTC Breakout Session Pivots
Dynamic Market Structure
Análisis de Puntos de Giro
Fibonacci Linear
Regresión Multi-temporal
Multi-Level Candle Bias
Tracker
Auto Support and
Resistance Trend Lines
All Support and
Resistance Levels
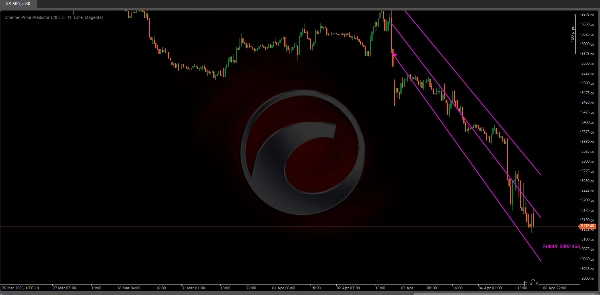
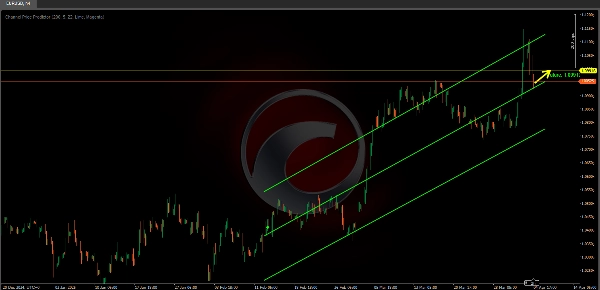
El Predictor de Precio del Canal identifica y dibuja un canal de tendencia (ya sea alcista o bajista) en el gráfico, extendiéndolo hacia el futuro para anticipar posibles zonas de precio. 📈🔮
El canal se basa en el ATR (Average True Range), que mide la volatilidad del mercado. Cuanto mayor sea la volatilidad reciente, más ancho será el canal, ayudando a visualizar el rango de movimientos probables. 📊💥
Identifica y dibuja automáticamente los canales basándose en los pivotes altos y bajos.
Opción para extender las líneas del canal y proyectar su precio futuro. 🕒📉
Este canal no solo muestra el movimiento actual sino que también te ofrece una proyección estimada del precio para el futuro mediante una etiqueta (“Futuro: …”) que indica el posible valor del precio. 📅💡
¿Para qué sirve?
Identificación de Tendencias:
El indicador utiliza una lógica interna para detectar cuando el mercado cambia de alcista a bajista (o viceversa). De esta manera, puedes visualizar más claramente si el activo está en una fase alcista o bajista. 📈🔄📉
Canales de Volatilidad:
El canal se basa en el ATR (Average True Range), que mide la volatilidad. Cuanto mayor sea la volatilidad reciente, más ancho será el canal. Esto te ayuda a ver el rango de movimientos probables. 📊🔍
Proyección Futura:
El indicador no solo muestra la tendencia actual sino que extiende el canal algunos períodos hacia adelante (configurable), para que puedas anticipar posibles zonas de soporte/resistencia dentro de esa tendencia. ⏳🚀
Te permite extender las líneas del canal y proyectar su precio futuro. ⬆️⬇️
Referencias de Precio:
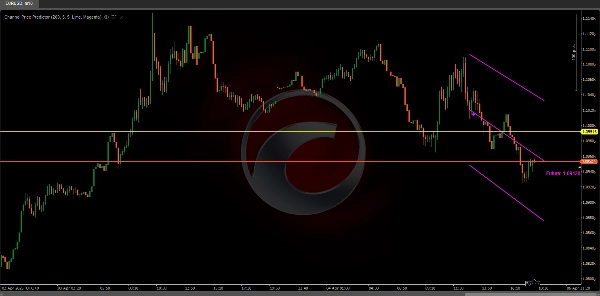
Al dibujar la línea central y los bordes superior e inferior, te ofrece referencias para colocar tus stops, objetivos o incluso para gestionar entradas/salidas con más información sobre la volatilidad. 🎯📍
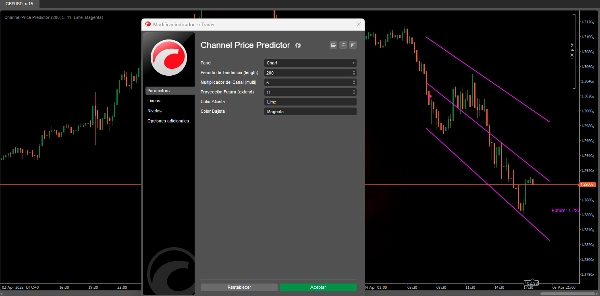
Debido a las limitaciones de cTrader, actualmente no es posible desplazarse hacia la derecha en el gráfico para ver correctamente las extensiones futuras del canal.
Se recomienda configurar el parámetro “Proyección Futura” a un valor menor a 25 períodos para evitar problemas de visualización.
Una vez que cTrader implemente la capacidad de extender el gráfico hacia el futuro, realizaremos mejoras en el algoritmo para aprovechar completamente esta funcionalidad.
Resumen
Key features include automatic detection of trend direction changes, visualization of current trend channels, and the ability to extend channel lines into the future. This future projection helps anticipate potential support and resistance zones by displaying estimated price values labeled as “Future: …”. The indicator draws a central line along with upper and lower channel boundaries, providing reference points for placing stops, targets, and managing trade entries and exits with volatility context.
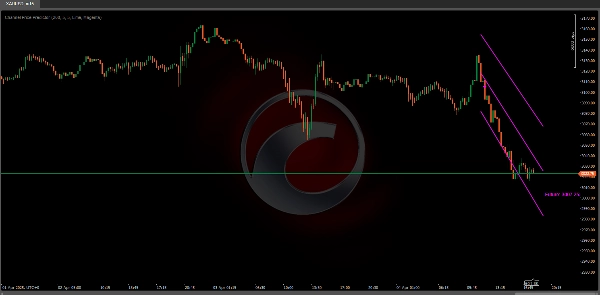
Users can configure the number of periods for future projection, with a recommended maximum of 25 periods to avoid display issues due to cTrader platform limitations. The indicator supports analysis of various markets including cryptocurrencies (e.g., BTCUSD), commodities (e.g., XAUUSD), and others where volatility and trend identification are relevant.
Valoraciones de clientes
5 | 100 % | |
4 | 0 % | |
3 | 0 % | |
2 | 0 % | |
1 | 0 % |