
คำอธิบาย
AdaptiveTrendChannel เป็นตัวบ่งชี้ที่ช่วยให้คุณ มองเห็นแนวโน้มตลาดได้อย่างชัดเจนและมีชีวิตชีวามากขึ้น 📈 แตกต่างจากค่าเฉลี่ยเคลื่อนที่ทั่วไปที่ ปรับตัวแบบเรียลไทม์ ตามการเปลี่ยนแปลงของราคา ช่วยให้คุณเห็น เมื่อแนวโน้มเปลี่ยนแปลง 🔄
🛠️ มันทำงานอย่างไร?
สิ่งแรกที่มันทำคือ สร้างเส้นอ้างอิงแบบไดนามิก ที่อัปเดตทุกแท่งเทียน 🕯️ คิดว่าเส้นนี้เป็น จุดสมดุล บอกคุณว่าราคากำลังอยู่ในโซนสมดุลหรือเคลื่อนที่ไปในทิศทางที่ชัดเจน
แต่เส้นนี้ไม่ได้ทำงานคนเดียว! มันยังพึ่งพา ระดับภายใน ที่ทำหน้าที่เป็น แนวรับและแนวต้านแบบไดนามิก 💪 ระดับเหล่านี้ปรับตัวอย่างต่อเนื่องตาม จุดสูงและต่ำล่าสุด 📉📈 หมายความว่าไม่ใช่ค่าคงที่—พวกมัน ปรับตามสภาพตลาด แบบเรียลไทม์
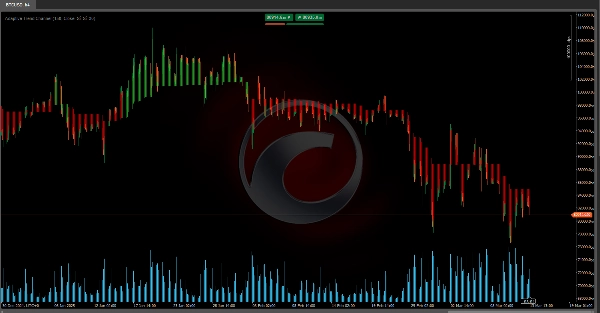
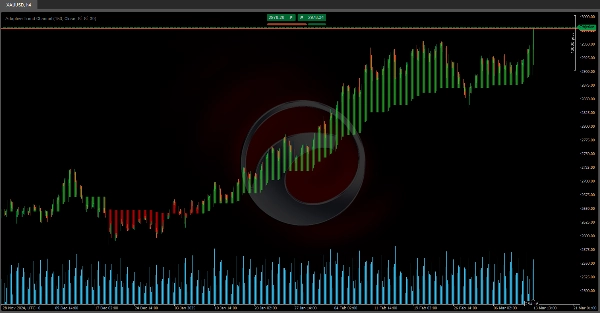
เมื่อราคานั้น เคลื่อนที่เหนือหรือต่ำกว่า ระดับไดนามิกเหล่านี้ ตัวบ่งชี้จะ ตรวจจับการเปลี่ยนแปลงแนวโน้ม และ สร้างสัญญาณ เพื่อให้ชัดเจนยิ่งขึ้น มัน ระบายสีพื้นที่ ระหว่างเส้นอ้างอิงและราคาปิด ทำให้แนวโน้ม มองเห็นได้อย่างชัดเจน 🎨👀
📌 วิธีใช้ในเทรดดิ้ง?
ตอนนี้ คุณจะใช้สิ่งนี้ในเทรดจริงอย่างไร? ง่ายมาก
✅ หากราคายังคงอยู่ เหนือ เส้นอ้างอิงหลายแท่งเทียน ตลาดถือว่าเป็น ตลาดกระทิง 🟢
❌ หากราคาตกลง ต่ำกว่า เส้นอ้างอิง ตลาดถือว่าเป็น ตลาดหมี 🔴
เนื่องจากเส้นนี้ ปรับตัวแบบไดนามิก และกรองเสียงรบกวนของตลาด มันจึงให้คุณเห็น ภาพแนวโน้มที่ชัดเจนขึ้น.
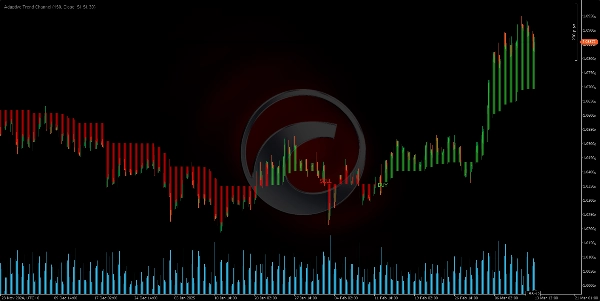
นอกจากนี้ ตัวบ่งชี้ยัง ติดตามการตัดกันล่าสุด:
🔻 หากราคาตัดลง ต่ำกว่า ระดับภายในสำคัญ มันส่งสัญญาณถึง ช่วงตลาดหมีที่อาจเกิดขึ้น.
🔺 หากราคาตัดขึ้น เหนือ ระดับภายในสำคัญ มันส่งสัญญาณถึง ช่วงตลาดกระทิงที่อาจเกิดขึ้น.
ด้วยข้อมูลนี้ ตัวบ่งชี้ทำสองสิ่งสำคัญ:
🎨 เปลี่ยนสี ของเส้นและพื้นที่กราฟ ให้คุณเห็น สัญญาณภาพทันที ของทิศทางแนวโน้ม
📢 สร้างสัญญาณซื้อ/ขาย เมื่อมีการตรวจพบการเปลี่ยนแปลงแนวโน้ม
🔥 ทำไมมันถึงทรงพลัง?
AdaptiveTrendChannel ช่วยให้คุณ อยู่ในฝั่งที่ถูกต้องของแนวโน้ม และหลีกเลี่ยงการเทรดสวนกับแรงขับเคลื่อนของตลาด มันเน้น ช่วงเวลาสำคัญ สำหรับ จุดเข้าและออก ให้คุณมี ข้อมูลอ้างอิงภาพที่ชัดเจน เพื่อการตัดสินใจเทรดที่ชาญฉลาดขึ้น
เมื่อรวมกับเครื่องมืออื่น ๆ เช่น การวิเคราะห์ปริมาณ หรือ การเคลื่อนไหวของราคา มันกลายเป็น พันธมิตรที่ทรงพลัง สำหรับการกรองการเทรดและเพิ่ม ความแม่นยำในการเข้าเทรด 🚀💰
ตัวบ่งชี้ Ctrader Store:
Dynamic Market Structure
Analysis of Turning Points
Fibonacci Linear
Regression Multi-timeframe
Multi-Level Candle Bias
Tracker
Auto Support and
Resistance Trend Lines
All Support and
Resistance Levels
สรุป
When the price moves above or below these adaptive levels, the indicator detects trend changes and produces buy or sell signals. It visually highlights trends by coloring the area between the reference line and the closing price, providing clear visual cues on trend direction. Traders can interpret price staying above the reference line as bullish and below it as bearish, with the indicator filtering out market noise for a cleaner trend view.
Additionally, the Adaptive Trend Channel tracks recent crossovers of key internal levels to signal potential bullish or bearish phases. It is intended to help traders stay aligned with market momentum and identify key entry and exit points. When combined with other tools like volume analysis or price action, it supports improved trade filtering and entry precision.
รีวิวจากลูกค้า
5 | 100 % | |
4 | 0 % | |
3 | 0 % | |
2 | 0 % | |
1 | 0 % |


