
Descrizione
🌟 **Cos'è lo Z-Score?** 🌟
• **Z-Score nel Trading**: È un modo per misurare quanto il prezzo attuale si discosta dalla sua media recente, espresso in termini di deviazioni standard. 😊 Un valore vicino a 0 indica che il prezzo è vicino alla sua media, mentre valori elevati (positivi o negativi) 😮 indicano che si è discostato significativamente.
• **Utilità Statistica**: Questi valori permettono di identificare situazioni in cui il prezzo è "ipercomprato" 📈 o "ipervenduto" 📉, il che può essere utile per strategie di ritorno alla media o per rilevare momenti di alta volatilità 💥.
🌟 **Come Funziona l'Indicatore** 🌟
1. **Calcolo della Media e della Deviazione**:
- Un numero specifico di barre (o periodi) precedenti viene analizzato per calcolare il prezzo di chiusura medio e la sua deviazione standard. 🧮
- Con questi valori si determina quanto il prezzo attuale si discosta dalla media. Questa differenza è espressa come Z-Score.
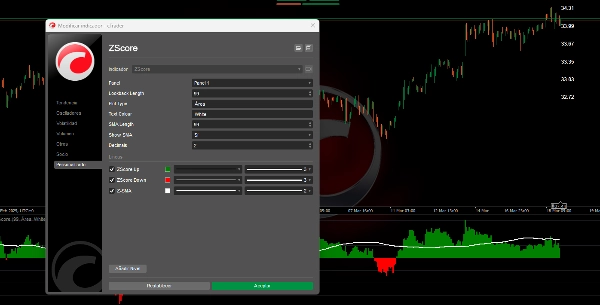
2. **Visualizzazione dello Z-Score**:
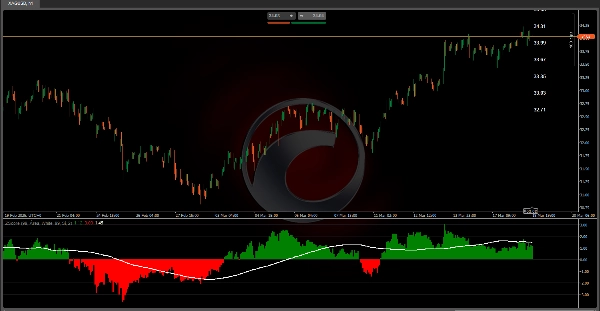
- **Modalità Area**: Vengono mostrati due istogrammi: uno verde 🟩 per valori positivi (quando il prezzo è sopra la media) e uno rosso 🔴 per valori negativi (quando è sotto). Questo permette di identificare visivamente l'entità e la direzione della deviazione.
3. **Media Mobile dello Z-Score**:
- Viene calcolata una media mobile sui valori dello Z-Score. Questo aiuta a smussare le fluttuazioni e a identificare le tendenze nel comportamento della deviazione del prezzo nel tempo. 📊
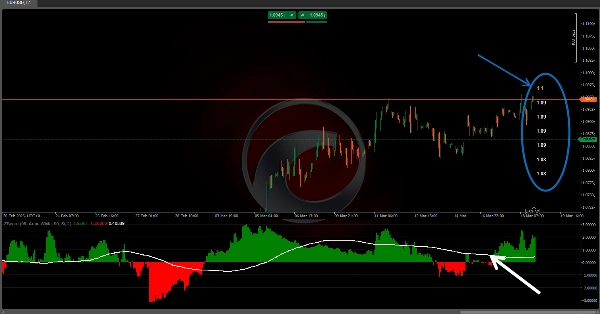
4. **Zone di Probabilità e Etichette di Riferimento**:
- Inoltre, vengono posizionate etichette sul grafico che mostrano i prezzi corrispondenti alla media e a ogni livello di deviazione. Questo è utile per comprendere, in termini di prezzo, quanto il mercato si stia comportando in modo "estremo". ⚠️
---
🌟 **Interpretazione e Applicazione per i Trader** 🌟
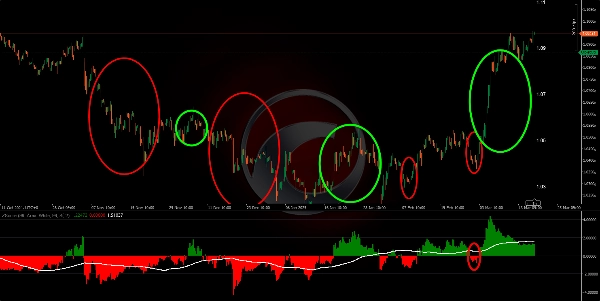
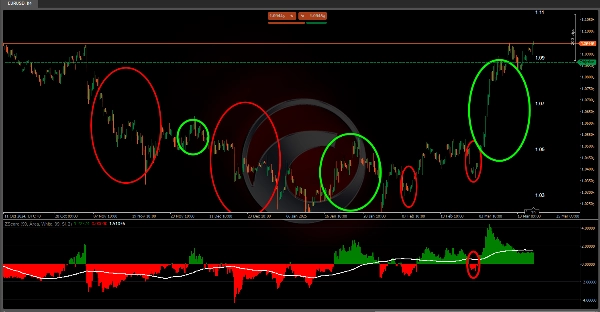
• **Rilevamento degli Estremi**: Osservando valori molto alti o molto bassi nell'indicatore, un trader può identificare che il prezzo si è allontanato significativamente dalla sua media. Questo può suggerire che è probabile una correzione (se si prevede un ritorno alla media) 🔄 o che si stia verificando una forte rottura.
• **Conferma della Tendenza**: La media mobile dello Z-Score e le bande associate permettono di vedere i cambiamenti nella tendenza del comportamento del prezzo rispetto alla sua media. Un incrocio o un cambiamento in queste linee può essere interpretato come un segnale di ingresso 🛡️ o uscita.
• **Gestione del Rischio**: Conoscendo i livelli di deviazione e le zone di probabilità, puoi regolare le dimensioni delle posizioni o definire punti di stop loss ⬇️ e take profit ⬆️, poiché hai un riferimento per movimenti normali rispetto a quelli estremi.
• **Comprensione Statistica del Mercato**: Oltre a essere solo uno strumento grafico, questo indicatore incoraggia a pensare al comportamento del mercato in termini probabilistici. Conoscere la "normalità" di un movimento può essere un fattore decisivo nella valutazione delle opportunità di trading. 🎯
🌟 **Conclusione** 🌟
Questo algoritmo converte i dati di prezzo in una rappresentazione statistica che aiuta a visualizzare e quantificare la deviazione del prezzo rispetto al suo comportamento recente. Combinando lo Z-Score, una media mobile, bande di deviazione e una tabella di probabilità, l'indicatore fornisce molteplici livelli di informazione. Questo lo rende particolarmente prezioso per identificare momenti in cui il mercato si trova in condizioni insolite, facilitando decisioni di ingresso 🚀, uscita 🛑 e gestione del rischio basate su probabilità e statistica. 📈📉
Indicatori del Ctrader Store:
Dynamic Market Structure
Analysis of Turning Points
Fibonacci Linear
Regression Multi-timeframe
Multi-Level Candle Bias
Tracker
Auto Support and
Resistance Trend Lines
Riepilogo
Recensioni dei clienti
5 | 100 % | |
4 | 0 % | |
3 | 0 % | |
2 | 0 % | |
1 | 0 % |


