
설명
Pinescritlabs
Ctrader Store indicators: 🤖Pinescritlabs Ctrader Store cBots:
Fair Value Gap Sessions Gold & BTC Breakout Session Pivots(new)
Dynamic Market Structure
Analysis of Turning Points
Fibonacci Linear
Regression Multi-timeframe
Multi-Level Candle Bias
Tracker
Auto Support and
Resistance Trend Lines
All Support and
Resistance Levels
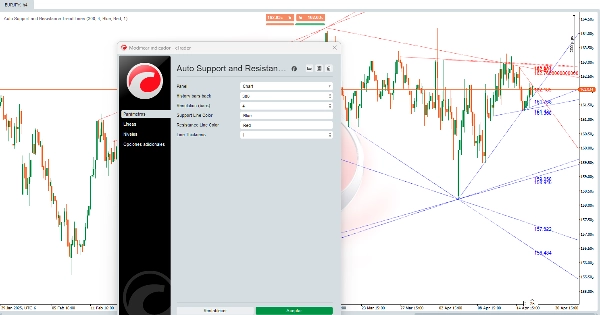
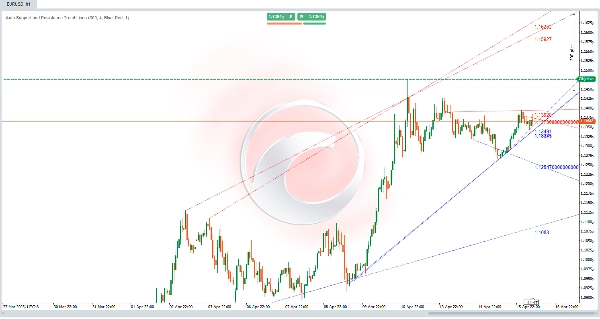
Auto Support and Resistance Trend Lines:
이 알고리즘은 강력한 도구 🛠️로 가격 차트에서 자동으로 지지선과 저항선을 식별하도록 설계되었습니다. 수평선을 그릴 뿐만 아니라 시장 추세를 나타내는 대각선 채널 ↗️↘️도 추적합니다. 이 수준과 채널은 가격이 더 높게(저항 🚧) 또는 더 낮게(지지 🛡️) 움직이기 어려웠던 핵심 영역으로, 거래 결정에 있어 중요한 지점입니다. 📈📉
계산은 어떻게 이루어지나요? 🔍
이 알고리즘은 가격 이력 분석 방법 📊을 사용하여 지지선과 저항선을 식별합니다. 작동 방식은 다음과 같습니다:
- 국소 저점과 고점 식별 ⬇️⬆️
-
- 알고리즘은 특정 범위의 바(캔들) 내에서 국소 저점(해당 범위 내 최저 가격)과 국소 고점(최고 가격)를 찾기 위해 가격을 분석합니다.
- 이 국소 저점과 고점은 잠재적인 지지선 및 저항선 후보입니다.
- 수준 검증 ✔️
-
- 국소 저점과 고점이 식별되면, 알고리즘은 과거에 가격이 이 수준들을 존중했는지를 확인합니다.
- 가격이 여러 번 해당 수준에 닿았지만 명확히 돌파하지 않았다면, 이는 유효한 지지선 또는 저항선으로 간주됩니다.
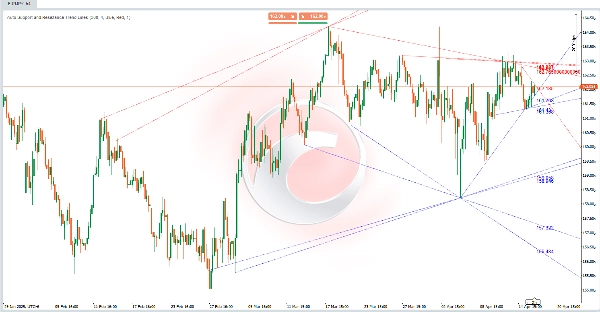
- 선과 채널 그리기 ✏️
-
- 지지선은 검증된 국소 저점에서 수평(또는 대각선) 선으로 그려집니다.
- 저항선은 검증된 국소 고점에서 수평(또는 대각선) 선으로 그려집니다.
- 또한 알고리즘은 이 수준들을 연결하여 대각선 채널 ↗️↘️을 형성하며, 이는 시장에서의 강세 또는 약세 추세를 나타냅니다.
- 동적 업데이트 🔄
-
- 이 지표는 새로운 바가 생성될 때마다 자동으로 업데이트되어 최신 가격 동향을 기반으로 지지선과 저항선을 재계산하고 다시 그립니다.
이 알고리즘이 트레이더에게 어떻게 도움이 되나요? 💡
이 알고리즘은 트레이더에게 게임 체인저입니다. 그 이유는 다음과 같습니다:
- 시장에 대한 거시적 관점 제공 🌐
-
- 대각선 채널을 그려 알고리즘은 주요 시장 추세를 보여주어, 트레이더가 가격이 상승 추세 📈, 하락 추세 📉, 또는 횡보 ↔️인지 식별하는 데 도움을 줍니다.
- 핵심 지지선 및 저항선 영역 식별 🎯
-
- 지지선과 저항선은 가격이 반등하거나 돌파할 수 있는 영역입니다. 이 수준들은 다음에 유용합니다:
-
- 거래의 진입 및 청산 지점 설정.
- 🛑 손절매와 익절 ✅ 주문 배치.
- 가격의 돌파 🚀 또는 반전 🔄 식별.
- 기술적 분석 간소화 🕒
-
- 알고리즘은 지지선과 저항선을 식별하는 과정을 자동화하여 수동 분석을 수행하는 트레이더의 시간을 절약합니다.
- 수준과 채널을 명확히 표시하여 트레이더가 더 정보에 기반한 결정을 내릴 수 있도록 돕습니다.
- 사용자 정의 가능 🎨
-
- 트레이더는 분석할 과거 바 수, 선 두께, 및 색상과 같은 매개변수를 조정하여 다양한 거래 스타일과 시각적 선호도에 맞게 지표를 맞춤 설정할 수 있습니다.
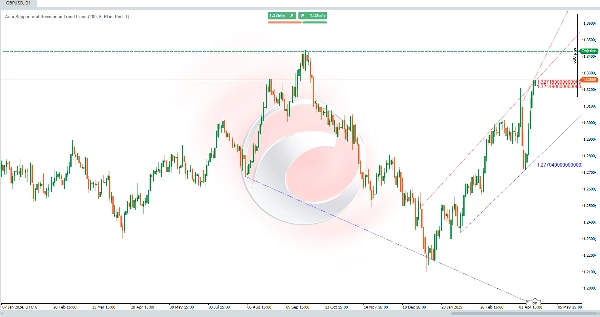
실용적인 예 📌
가격 차트를 분석하고 있다고 가정해 보겠습니다. 알고리즘이 다음을 그렸습니다:
- 여러 국소 저점을 연결하는 대각선 지지선 ↗️로, 상승 추세를 나타냅니다.
- 여러 국소 고점을 연결하는 대각선 저항선 ↗️로, 상승 채널을 보여줍니다.
- 여러 개의 수평선으로 주요 지지선과 저항선을 나타냅니다.
이 정보를 바탕으로 다음을 할 수 있습니다:
- 가격이 상승 추세 📈임을 식별합니다.
- 대각선 지지선이나 수평 지지선 근처에서 매수 기회를 찾습니다.
- 가장 가까운 지지선 아래에 손절매 🛑를 설정합니다.
- 가격이 저항선을 돌파하는지 관찰하여 추세 지속 또는 잠재적 반전 🔄을 확인합니다.
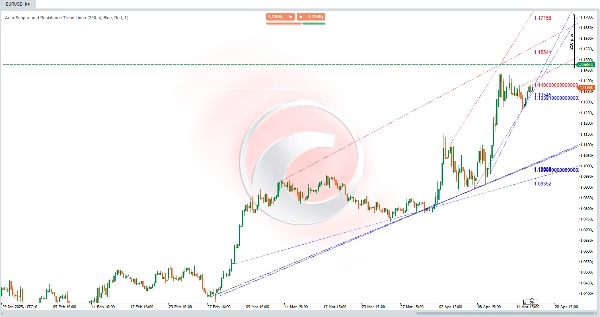
요약
Once validated, support and resistance levels are drawn as horizontal or diagonal lines, and connected to form channels indicating bullish or bearish trends. The indicator updates dynamically with each new bar, recalculating and redrawing levels to reflect the most recent price behavior.
This tool aids traders by providing a macro view of market trends, identifying zones where price may bounce or break, and simplifying technical analysis through automation. It supports setting entry and exit points, stop-loss and take-profit orders, and spotting potential breakouts or reversals. Parameters such as the number of historical bars analyzed, line thickness, and colors can be customized to fit different trading styles and preferences.


