Açıklama
AdaptiveTrendChannel, piyasa trendlerini daha net ve dinamik bir şekilde görselleştirmenize yardımcı olan bir göstergedir. 📈 Normal bir hareketli ortalamadan farklı olarak, fiyat gelişirken gerçek zamanlı olarak uyum sağlar ve böylece trend değişimlerini görmenizi sağlar. 🔄
🛠️ Nasıl Çalışır?
İlk yaptığı şey, her mum ile güncellenen dinamik bir referans çizgisi oluşturmak. 🕯️ Bu çizgiyi, fiyatın denge bölgesinde mi yoksa belirgin bir yönde mi hareket ettiğini gösteren bir denge noktası olarak düşünebilirsiniz.
Ama bu çizgi tek başına çalışmaz! Ayrıca dinamik destek ve dirençler olarak işlev gören iç seviyelere dayanır. 💪 Bu seviyeler, son yüksekler ve düşükler 📉📈 baz alınarak sürekli ayarlanır, yani sabit değildirler—piyasa koşullarına gerçek zamanlı uyum sağlarlar.
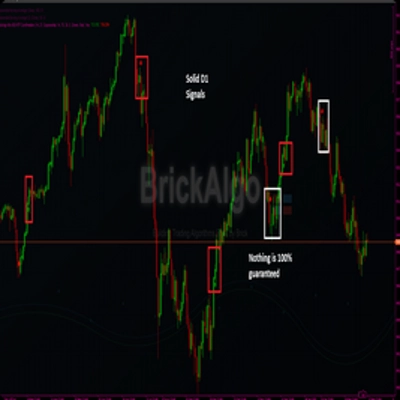
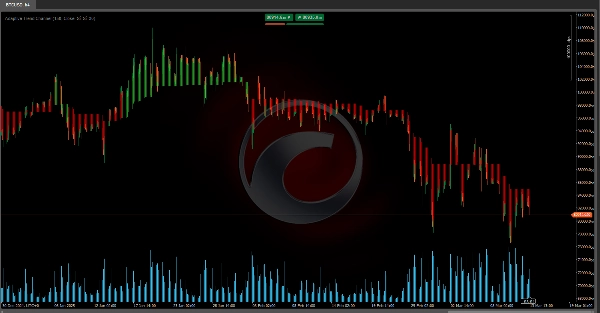
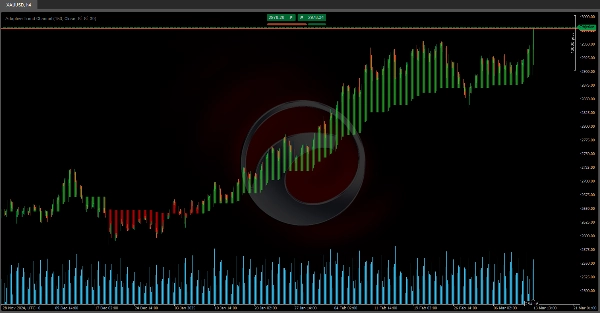
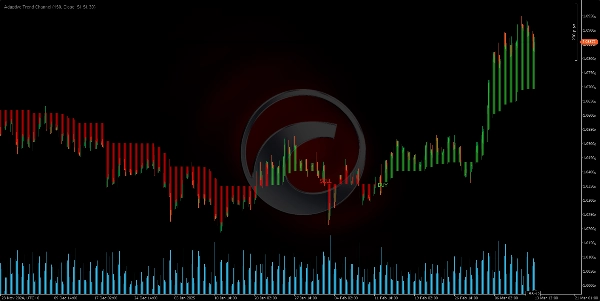
Fiyat bu dinamik seviyelerin üzerine veya altına hareket ettiğinde, gösterge bir trend değişimini algılar ve sinyaller üretir. Durumu daha da netleştirmek için, referans çizgisi ile kapanış fiyatı arasındaki alanı renklendirir ve böylece trendleri görsel olarak belirgin hale getirir. 🎨👀
📌 Ticarette Nasıl Kullanılır?
Şimdi, bunu gerçek işlemlerde nasıl uygularsınız? Çok kolay.
✅ Fiyat, referans çizgisinin üzerinde birden fazla mum boyunca kalıyorsa, piyasa boğa piyasası olarak kabul edilir. 🟢
❌ Fiyat, referans çizgisinin altına düşerse, piyasa ayı piyasası olarak kabul edilir. 🔴
Bu çizgi dinamik olarak ayarlandığı ve piyasa gürültüsünü filtrelediği için, size daha temiz bir trend görünümü sunar.
Ayrıca, gösterge son kesişimleri takip eder:
🔻 Fiyat, önemli bir iç seviyenin altına düşerse, potansiyel bir ayı dönemi sinyali verir.
🔺 Fiyat, önemli bir iç seviyenin üzerine çıkarsa, potansiyel bir boğa dönemi sinyali verir.
Bu bilgilerle, gösterge iki önemli iş yapar:
🎨 Çizgi ve grafik alanının rengini değiştirir, böylece size trend yönü hakkında anlık görsel ipucu verir.
📢 Trend değişimi algılandığında al/sat sinyalleri üretir.
🔥 Neden Bu Kadar Güçlü?
AdaptiveTrendChannel, doğru trend tarafında kalmanıza ve piyasa momentumuna karşı işlem yapmaktan kaçınmanıza yardımcı olur. Giriş ve çıkış noktaları için önemli anları vurgular ve size daha akıllı işlem kararları için net bir görsel referans sunar.
Hacim analizi veya fiyat hareketi gibi diğer araçlarla birleştirildiğinde, işlemleri filtrelemek ve giriş hassasiyetini artırmak için güçlü bir yardımcı olur. 🚀💰
Ctrader Store göstergeleri:
Dynamic Market Structure
Analysis of Turning Points
Fibonacci Linear
Regression Multi-timeframe
Multi-Level Candle Bias
Tracker
Auto Support and
Resistance Trend Lines
All Support and
Resistance Levels
Özet
When the price moves above or below these adaptive levels, the indicator detects trend changes and produces buy or sell signals. It visually highlights trends by coloring the area between the reference line and the closing price, providing clear visual cues on trend direction. Traders can interpret price staying above the reference line as bullish and below it as bearish, with the indicator filtering out market noise for a cleaner trend view.
Additionally, the Adaptive Trend Channel tracks recent crossovers of key internal levels to signal potential bullish or bearish phases. It is intended to help traders stay aligned with market momentum and identify key entry and exit points. When combined with other tools like volume analysis or price action, it supports improved trade filtering and entry precision.
Müşteri değerlendirmeleri
5 | 100 % | |
4 | 0 % | |
3 | 0 % | |
2 | 0 % | |
1 | 0 % |