Broker & Prop
Untuk perniagaan
00
Days
:
00
Hours
:
00
Minutes
:
00
Seconds
Indikator
RSI
Breakout
XAUUSD
ATR
Commodities
Supertrend
Crypto
BTCUSD
Channel Price Predictor
5.0
03/09/2025
306
Desktop
Sejak 03/10/2024
Jualan
130
Pemasangan percuma
25902
Imej yang dimuat naik "Channel Price Predictor"Imej yang dimuat naik "Channel Price Predictor"Imej yang dimuat naik "Channel Price Predictor"Imej yang dimuat naik "Channel Price Predictor"Imej yang dimuat naik "Channel Price Predictor"

 Pinescritlabs
Ctrader Store indicators:                        🤖Pinescritlabs Ctrader Store cBots:

 Fair Value Gap Sessions                         Gold & BTC Breakout Session Pivots

ZigZag

 BOS & CHOCH

RSI Trend Trigger

Channel Breakout System

Supertrend

Market Imbalance

Adaptive Trend Channel 

Dynamic Market Structure
Analysis of Turning Points

Order Block

Fibonacci Linear
Regression Multi-timeframe

Volume POC Heatmap

Dynamic RSI

Momentum Fair Value Gap

Market Flow Projection

Dynamic Trend Gradient

Multi-Level Candle Bias
Tracker

Zig-Zag Extremity Tracker

Reactive Moving Average

Auto-Trend Channel

Auto Support and
Resistance Trend Lines

All Support and
Resistance Levels

Leverage Liquidation Map

Zones Supply Demand

Dynamic Range Momentum


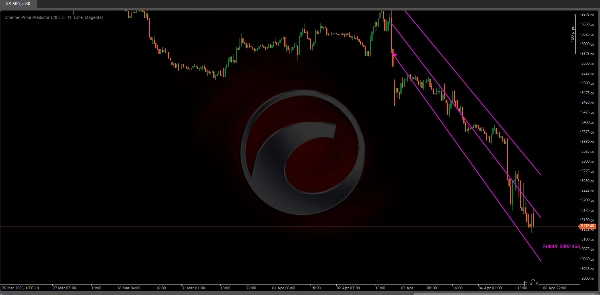
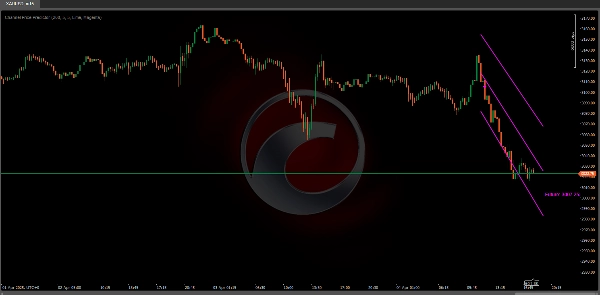
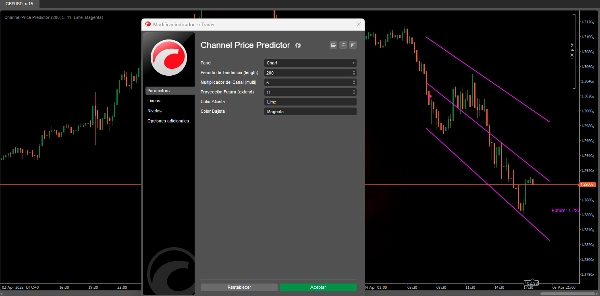
The Channel Price Predictor identifies and draws a trend channel (either bullish or bearish) on the chart, extending it into the future to anticipate possible price zones. 📈🔮

The channel is based on the ATR (Average True Range), which measures market volatility. The higher the recent volatility, the wider the channel, helping to visualize the range of probable movements. 📊💥

It automatically identifies and draws the channels based on pivot highs and lows.

Option to extend the channel lines and project their future price. 🕒📉

This channel not only shows the current movement but also gives you an estimated price projection for the future through a label (“Future: …”) indicating the possible price value. 📅💡

What is it for?

Trend Identification:

The indicator uses an internal logic to detect when the market switches from bullish to bearish (or vice versa). This way, you can more clearly visualize whether the asset is in an upward or downward phase. 📈🔄📉

Volatility Channels:

The channel is based on the ATR (Average True Range), which measures volatility. The higher the recent volatility, the wider the channel. This helps you see the range of probable movements. 📊🔍
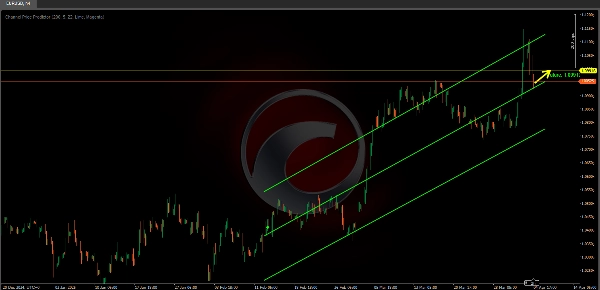
Future Projection:

The indicator doesn’t just show the current trend but extends the channel a few periods ahead (configurable), so you can anticipate possible support/resistance zones within that trend. ⏳🚀

It allows you to extend the channel lines and project their future price. ⬆️⬇️
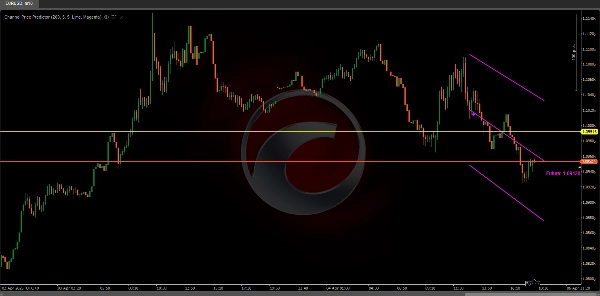
Price References:

By drawing the central line and the upper and lower edges, it gives you references to place your stops, targets, or even to manage entries/exits with more information on volatility. 🎯📍


Due to cTrader limitations, it is currently not possible to scroll to the right on the chart to properly view the future extensions of the channel.

It is recommended to set the “Future Projection” parameter to a value less than 25 periods to avoid display issues.

Once cTrader implements the ability to extend the chart into the future, we will make improvements to the algorithm to fully take advantage of this functionality.


5.0
Ulasan: 1
5
100 %
4
0 %
3
0 %
2
0 %
1
0 %
Ulasan pelanggan
August 18, 2025
Accurate dynamic price channels, customizable, low system load. Cons: No alerts, no MTF mode, no auto-trading integration.
Lebih banyak produk daripada penulis ini
Dinilai teratas
Percuma
Indikator
RSI
Breakout
XAUUSD
+6
ZigZag
ZigZag filters noise, spots trends, patterns, pivots, aiding analysis, trade management, and confirmations. 📉📈
Indikator
RSI
Breakout
XAUUSD
+6
Order Block
Identify bullish and bearish Order Blocks to spot key support/resistance levels and potential trend reversals! 📈🔄
Indikator
RSI
Breakout
XAUUSD
+5
Auto-Trend Channel
Adaptive trend channel using linear regression and Pearson correlation for dynamic support, resistance, and trends.
Indikator
RSI
XAUUSD
Breakout
+5
BOS & CHOCH
Market structural patterns , specifically the concepts of Change of Character (ChoCH) 🔄 and Break of Structure (BoS) 💥
Indikator
RSI
Breakout
XAUUSD
+6
Volume POC Heatmap
📊 Shows volume by price levels, highlights POC, and key zones. Identifies dynamic support/resistance and imbalances.
Indikator
RSI
Breakout
Supertrend
All Support and Resistance Levels
"Identify key market zones and visualize support/resistance from multiple timeframes on a single chart.
Indikator
RSI
Breakout
XAUUSD
+5
Zones Supply Demand
📊Zones Supply & Demand: Identifies key price levels with high volume concentration, marking Supply/Demand Zones & Marke
Indikator
RSI
Breakout
XAUUSD
+5
Supertrend
💹 Define a price channel 📈 and determine trend direction (bullish 🟢 or bearish 🔴).
Indikator
RSI
Breakout
XAUUSD
+6
Fair Value Gap Sessions
identify and highlight temporary market inefficiencies known as "fair value gaps" 🚨 within specific trading Sessions.
Indikator
RSI
Breakout
XAUUSD
+4
Dynamic Market Structure Analysis of Turning Points
Identify market structure effortlessly with swing highs, lows, CHoCH, and BOS levels for smart trading decisions! 📊🔍"
Indikator
Indices
RSI
XAUUSD
+7
RSI Divergence
Detects bullish and bearish divergences
Advanced Market Structure Bos,Choch,SwinLevels, Order Blog
Advanced price action tool that combines multiple technical analysis concepts
Indikator
RSI
Breakout
Supertrend
Swing Levels
🔍 Automatically detect support and resistance levels based on "swings" or pivots
Indikator
RSI
Breakout
Supertrend
Trend Heikin Multi MA
🚀 TrendHeikinMultiMA: Advanced trend detection using Heikin-Ashi smoothing & MAs! Eliminates noise, confirms real trend
Indikator
RSI
Breakout
XAUUSD
+4
Multi-Level Candle Bias Tracker
Price direction by calculating the probability of reaching new highs/lows. Shows levels & stats📈
Indikator
RSI
Breakout
Supertrend
Leverage Liquidation Map
📊 Liquidation Map: Potential areas where highly leveraged investors might face liquidations.
Indikator
RSI
XAUUSD
Breakout
+4
ICT Power of 3
🎯 Auto-plots key zones (Accumulation, Manipulation, Distribution) . Reveals institutional traps & trends.
Indikator
NAS100
NZDUSD
XAUUSD
+9
PineScriptLabs Smart Signals CDRC Auto TPSL
🎯Smart Signals : Auto Buy/Sell alerts with dynamic TP/SL algorithm. 💡
Anda juga mungkin suka
Indikator
Breakout
Signal
SMC
Free_ICT Breakers_BOS_MSS_withSourceCode
ICT Breakers (BOS/MSS) - Professional market structure and breakout detection tool.
Indikator
NAS100
NZDUSD
XAUUSD
+12
Auto Chart Patterns
🎯Automatically detects and visualizes classical chart patterns using multi-timeframe swing point analysis.
Indikator
NAS100
XAUUSD
Stocks
+4
Orderblock Detector
This indicator displays the OrderBlocks of the current and higher timeframe, made by ICT's student.
Indikator
Grid
NAS100
XAUUSD
+6
AutoFibRetracement
A powerful overlay tool designed to automatically plot Fibonacci retracement levels based on a custom window.
Risk Reward Guardian Scalping Swing Intraday Assistant
Trade fearlessly: auto-adjusts order blocks, manages risks, and ensures precision.
Dinilai teratas
Percuma
Indikator
Indices
Prop
Commodities
+3
Period Separator
Period Separator that shows on all timeframes including renko and range bars.
Indikator
Breakout
Stocks
Forex
+2
WaveWeisBarForce
Wave Weis Bar Force - is an indicator that applies the logic of Volume waves (Weis) to determine accumulation
Indikator
NAS100
RSI
NZDUSD
+19
Bounty stop
the indicator that hunts stop-loss liquidity before the big players do.
Indikator
Indices
Forex
Crypto
ICT Order Block
Order block
Indikator
Indices
Forex
USDJPY
JPYX w HMA
JPYX Indicator with HMA
Indikator
NAS100
XAUUSD
Forex
+3
Linear Regression Oscillator
The Linear Regression Oscillator (LRO) is a technical indicator based on linear regression analysis.
Indikator
Breakout
Institutional Flow Radar
Institutional Flow Radar scans the chart for abnormal volume events and classifies them into two groups: Capital &Public
Indikator
NAS100
NZDUSD
Forex
+23
Project Horizon New H.O.P.E
Project Horizon: New H.O.P.E Adaptive Trading Intelligence for Modern Markets,constantly evolving and user driven
Indikator
RSI
Breakout
XAUUSD
+4
Dynamic Market Structure Analysis of Turning Points
Identify market structure effortlessly with swing highs, lows, CHoCH, and BOS levels for smart trading decisions! 📊🔍"
Indikator
NAS100
NZDUSD
Martingale
+26
MACD ColorFlow Moving Average v1
MACD ColorFlow Moving Average, A clean, visual trend line driven by MACD momentum.
Indikator
RSI
XAUUSD
ATR
+3
RSI NextGen
The RSI NextGen is an advanced and modernized version of the classic Relative Strength Index (RSI)
Market Sessions
Market Sessions is very important for traders.
BWMFI_Visual
BW_MFI Vizual colors bars