
説明
Pinescritlabs
Ctrader Store indicators: 🤖Pinescritlabs Ctrader Store cBots:
Fair Value Gap Sessions Gold & BTC Breakout Session Pivots(new)
Dynamic Market Structure
Analysis of Turning Points
Fibonacci Linear
Regression Multi-timeframe
Multi-Level Candle Bias
Tracker
Auto Support and
Resistance Trend Lines
All Support and
Resistance Levels
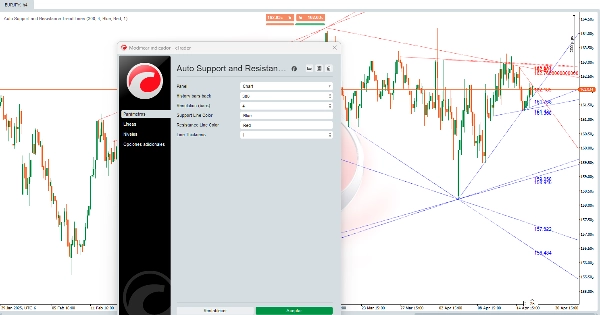
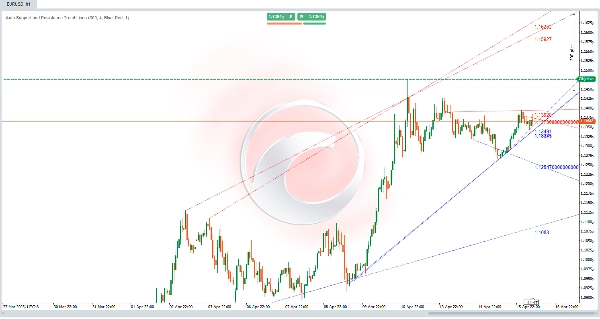
Auto Support and Resistance Trend Lines:
このアルゴリズムは 強力なツール 🛠️で、価格チャート上のサポートおよびレジスタンスレベルを自動的に識別するよう設計されています。水平線を描くだけでなく、市場のトレンドを表す 斜めのチャネル ↗️↘️もトレースします。これらのレベルとチャネルは、価格が上昇(レジスタンス 🚧)または下降(サポート 🛡️)するのに苦労した 重要なエリアであり、取引の意思決定において 重要なポイントとなります。📈📉
計算はどのように行われますか? 🔍
このアルゴリズムは 価格履歴分析アプローチ 📊を使用してサポートおよびレジスタンスレベルを特定します。仕組みは次のとおりです:
- 局所的な安値と高値の特定 ⬇️⬆️
-
- アルゴリズムは特定のバー(ローソク足)範囲の価格を分析し、 局所的な安値(その範囲内の最安値)と 局所的な高値(その範囲内の最高値)を見つけます。
- これらの局所的な安値と高値は、 サポートおよびレジスタンスレベルになる可能性のある候補です。
- レベルの検証 ✔️
-
- 局所的な安値と高値が特定された後、アルゴリズムはこれらのレベルが過去に価格によって 尊重されているかどうかを確認します。
- 価格がレベルを明確に破らずに複数回触れている場合、それは 有効なサポートまたはレジスタンスレベルと見なされます。
- ラインとチャネルの描画 ✏️
-
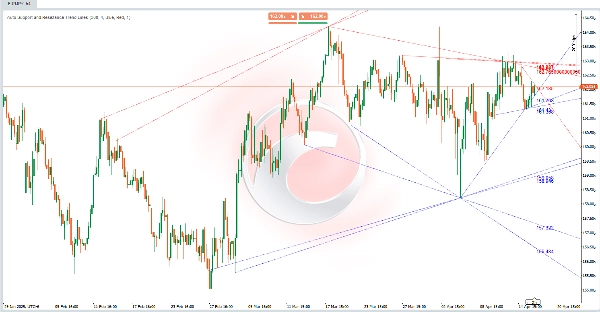
- サポートレベルは、検証された局所的な安値で 水平(または斜め)線として描かれます。
- レジスタンスレベルは、検証された局所的な高値で 水平(または斜め)線として描かれます。
- さらに、アルゴリズムはこれらのレベルを接続して 斜めチャネル ↗️↘️を形成し、市場の 強気または弱気のトレンドを表します。
- 動的な更新 🔄
-
- インジケーターは各新しいバーごとに 自動的に更新し、最新の価格動向に基づいてサポートおよびレジスタンスレベルを再計算および再描画します。
このアルゴリズムはトレーダーにどのように役立ちますか? 💡
このアルゴリズムはトレーダーにとって ゲームチェンジャーです。その理由は:
- 市場のマクロビューを提供 🌐
-
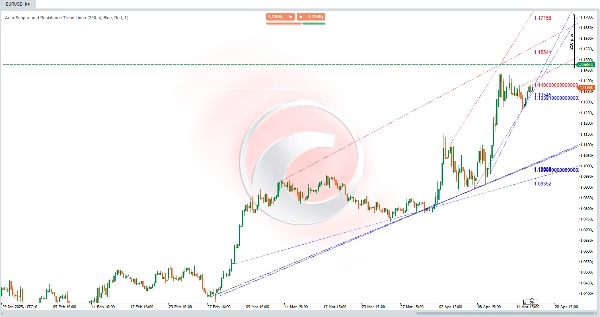
- 斜めチャネルを描くことで、アルゴリズムは 主要な市場トレンドを示し、価格が 上昇トレンド 📈、 下降トレンド 📉、または 横ばいの動き ↔️にあるかをトレーダーが識別するのに役立ちます。
- 重要なサポートおよびレジスタンスエリアを特定 🎯
-
- サポートおよびレジスタンスレベルは、価格が 反発または突破する可能性のある ゾーンです。これらのレベルは以下に役立ちます:
-
- 取引の エントリーおよびエグジットポイントの設定。
- ストップロス 🛑およびテイクプロフィット ✅注文の配置。
- 価格の ブレイクアウト 🚀や 反転 🔄の識別。
- テクニカル分析を簡素化 🕒
-
- アルゴリズムはサポートおよびレジスタンスの特定プロセスを 自動化し、手動分析を行うトレーダーの時間を節約します。
- レベルとチャネルを明確に表示することで、トレーダーが より情報に基づいた意思決定を行うのに役立ちます。
- カスタマイズ可能 🎨
-
- トレーダーは 分析する履歴バーの数、 線の太さ、および 色などのパラメーターを調整でき、インジケーターをさまざまな取引スタイルや視覚的好みに合わせて調整できます。
実用例 📌
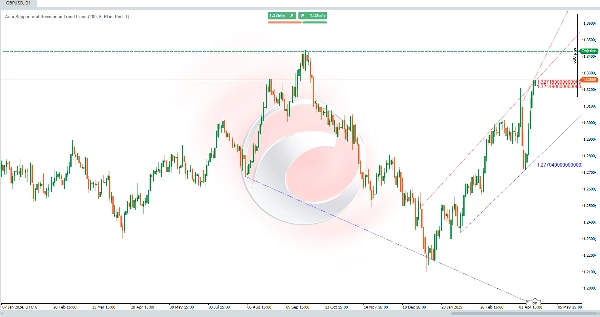
価格チャートを分析していると想像してください。アルゴリズムは以下を描いています:
- いくつかの局所的な安値を結ぶ 斜めのサポートライン ↗️で、上昇トレンドを示しています。
- いくつかの局所的な高値を結ぶ 斜めのレジスタンスライン ↗️で、上昇チャネルを示しています。
- いくつかの 水平線で、重要なサポートおよびレジスタンスレベルを表しています。
この情報を使って、あなたは以下のことができます:
- 価格が 上昇トレンド 📈にあることを識別します。
- 斜めのサポートラインや水平のサポートレベル付近で 買いの機会を探します。
- 最も近いサポートレベルの下に ストップロス 🛑を設定します。
- 価格がレジスタンスを 突破するかどうかを観察し、トレンドの継続または潜在的な 反転 🔄を確認します。
概要
Once validated, support and resistance levels are drawn as horizontal or diagonal lines, and connected to form channels indicating bullish or bearish trends. The indicator updates dynamically with each new bar, recalculating and redrawing levels to reflect the most recent price behavior.
This tool aids traders by providing a macro view of market trends, identifying zones where price may bounce or break, and simplifying technical analysis through automation. It supports setting entry and exit points, stop-loss and take-profit orders, and spotting potential breakouts or reversals. Parameters such as the number of historical bars analyzed, line thickness, and colors can be customized to fit different trading styles and preferences.


