Descrição
O AdaptiveTrendChannel é um indicador que ajuda você a visualizar as tendências do mercado de forma mais clara e dinâmica. 📈 Diferente de uma média móvel comum, ele se adapta em tempo real conforme o preço evolui, permitindo que você veja quando a tendência está mudando. 🔄
🛠️ Como Funciona?
A primeira coisa que ele faz é gerar uma linha de referência dinâmica que se atualiza a cada candle. 🕯️ Pense nessa linha como um ponto de equilíbrio, indicando se o preço está em uma zona de equilíbrio ou se movendo em uma direção clara.
Mas essa linha não funciona sozinha! Ela também depende de níveis internos que atuam como suportes e resistências dinâmicos. 💪 Esses níveis estão constantemente se ajustando com base nas máximas e mínimas recentes 📉📈, ou seja, não são fixos—eles se adaptam às condições do mercado em tempo real.
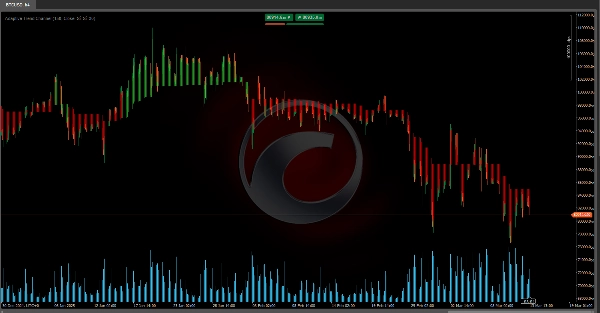
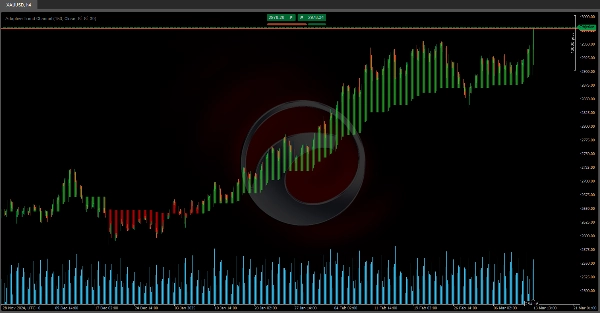
Quando o preço se move acima ou abaixo desses níveis dinâmicos, o indicador detecta uma mudança de tendência e gera sinais. Para tornar tudo ainda mais claro, ele colore a área entre a linha de referência e o preço de fechamento, tornando as tendências visualmente óbvias. 🎨👀
📌 Como Usar no Trading?
Agora, como aplicar isso em negociações reais? Fácil.
✅ Se o preço permanecer acima da linha de referência por vários candles, o mercado é considerado altista. 🟢
❌ Se o preço cair abaixo da linha de referência, o mercado é considerado baixista. 🔴
Como essa linha se ajusta dinamicamente e filtra o ruído do mercado, ela oferece uma visão mais limpa da tendência.
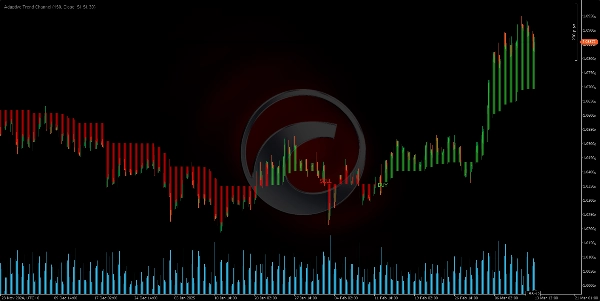
Além disso, o indicador acompanha cruzamentos recentes:
🔻 Se o preço cruza para baixo de um nível interno chave, sinaliza uma fase potencialmente baixista.
🔺 Se o preço cruza para cima de um nível interno chave, sinaliza uma fase potencialmente altista.
Com essas informações, o indicador faz duas coisas principais:
🎨 Muda a cor da linha e da área do gráfico, dando a você uma indicação visual instantânea sobre a direção da tendência.
📢 Gera sinais de compra/venda quando uma mudança de tendência é detectada.
🔥 Por Que É Tão Poderoso?
O AdaptiveTrendChannel ajuda você a ficar do lado certo da tendência e evitar operar contra o momentum do mercado. Ele destaca momentos-chave para pontos de entrada e saída, oferecendo uma referência visual clara para decisões de trading mais inteligentes.
Quando combinado com outras ferramentas como análise de volume ou ação do preço, ele se torna um aliado poderoso para filtrar operações e melhorar a precisão das entradas. 🚀💰
Indicadores da Ctrader Store:
Dynamic Market Structure
Analysis of Turning Points
Fibonacci Linear
Regression Multi-timeframe
Multi-Level Candle Bias
Tracker
Auto Support and
Resistance Trend Lines
All Support and
Resistance Levels
Resumo
When the price moves above or below these adaptive levels, the indicator detects trend changes and produces buy or sell signals. It visually highlights trends by coloring the area between the reference line and the closing price, providing clear visual cues on trend direction. Traders can interpret price staying above the reference line as bullish and below it as bearish, with the indicator filtering out market noise for a cleaner trend view.
Additionally, the Adaptive Trend Channel tracks recent crossovers of key internal levels to signal potential bullish or bearish phases. It is intended to help traders stay aligned with market momentum and identify key entry and exit points. When combined with other tools like volume analysis or price action, it supports improved trade filtering and entry precision.
Avaliações de clientes
5 | 100 % | |
4 | 0 % | |
3 | 0 % | |
2 | 0 % | |
1 | 0 % |