
Descrição
🚀 Mais de 10.000 traders já usam nossos PRINCIPAIS indicadores🏆
👉 Obtenha todos os nossos PRINCIPAIS sistemas aqui:
_______________________________________________
📌 Indicadores de Estrutura de Mercado
· ✅ AdvancedMarket Structure: Bos, Choch, SwinLevels, Order Blocks, Market Structure& Liquidity Finder
📊 Detector de Rompimento de Pivot
· 🔄 Análise Dinâmica da Estrutura de Mercado de Pontos de Virada
· 🧱 Bloco de Ordem
· ⛓️ BOS & CHOCH
· 🧠 ICT Power of 3
· 🌀 Zonas de Polaridade de Mercado
_______________________________________________
🔚 Sistemas Inteligentes de Saída
· 📍 Algoritmo Inteligente de Trailing
_______________________________________________
📐 Indicadores ZigZag
· 🔍 Projeção de Liquidez de Preço ZigZag
· ➖ ZigZag
· 🎯 Rastreador de Extremos Zig-Zag
_______________________________________________
🧱 Indicadores de Suporte e Resistência
· 🟩 Linhas de Suporte e Resistência SmartTrend
· 🧱 Todos os Níveis de Suporte e Resistência
_______________________________________________
📊 Indicadores de Tendência e Canal
· 🔄 Canal de Tendência Automático
· 📊 Supertrend
· ⚡Analisador de Tendência Momentum
· 🧠 Canal de Tendência Adaptativo
· 💥 Sistema de Rompimento de Canal
· 🌈 Gradiente Dinâmico de Tendência
_______________________________________________
💧 Ferramentas de Volume e Liquidez
· 🔥 Mapa de Calor do Volume POC
· 📉 Mapa de Liquidação de Alavancagem
· 🔍 Gap de Valor Justo de Momentum
· 🕒 Sessões de Gap de Valor Justo
_______________________________________________
⚡ Indicadores de Momentum e RSI
· 🚀 Momentum de Alcance Dinâmico
· 🔎 Viés de Vela Multi-Nível
Rastreador
_______________________________________________
🔮 Ferramentas de Previsão e Projeção
· 📐 Previsão Baseada em Linreg& ATR
· 📏 Regressão Linear Fibonacci Multi-tempo
· 📈 Projetor de Fluxo de Mercado Alimentado por Volume
________________________________________________________________________________________
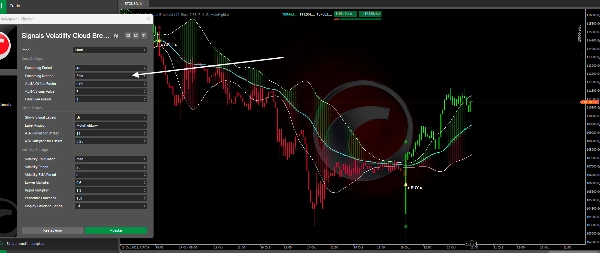
SINAIS DE ROMPIMENTO DA NUVEM DE VOLATILIDADE.
Visão Geral 💡
Adaptive Trend Bands é um indicador avançado de seguimento de tendência que combina filtragem adaptativa de preço com bandas dinâmicas de volatilidade. Ao contrário dos indicadores tradicionais de bandas estáticas, este sistema ajusta automaticamente sua sensibilidade de acordo com as condições de mercado em mudança, fornecendo sinais mais precisos em diferentes ambientes de volatilidade. 🎯
O Que Este Indicador Faz? 🤔
O indicador gera uma representação filtrada e suavizada do preço (OHLC) que elimina o ruído do mercado, permitindo visualizar a tendência subjacente com maior clareza. Simultaneamente, calcula bandas superiores e inferiores que se expandem ou contraem automaticamente com base na volatilidade atual, adaptando-se a mercados calmos ou turbulentos. 🌊
Principais Características: ✨
- Filtragem adaptativa de preço usando algoritmos ALMA ou EMA
- Bandas de volatilidade que se ajustam dinamicamente usando percentis históricos
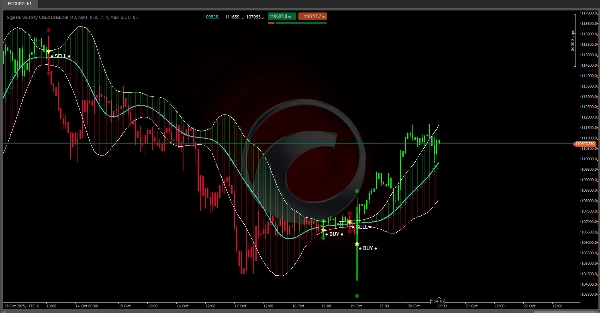
- Sinais visuais de COMPRA/VENDA quando o preço cruza as bandas 🟢🔴
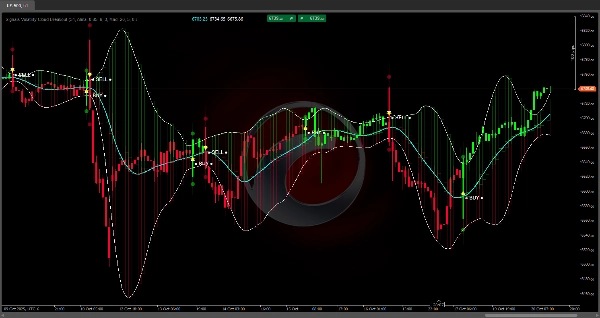
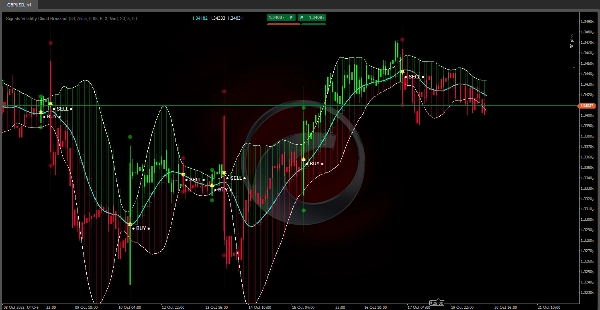
- Coloração das velas baseada na tendência detectada (verde alta / vermelho baixa)
- Nuvens coloridas entre as linhas filtradas para visualizar a força da tendência 💪
Como Funciona? ⚙️
Sistema de Filtragem
O indicador aplica um processo de suavização em duas etapas ao preço:
- Primeira Camada: Usa filtros ALMA (Média Móvel de Arnaud Legoux) ou EMA tradicionais para eliminar flutuações de curto prazo. ALMA é especialmente eficaz porque reduz o atraso mantendo a suavidade.
- Segunda Camada: Aplica uma suavização EMA adicional ao resultado do primeiro filtro, criando uma linha de tendência ultra-suave que reage de forma equilibrada às mudanças de preço.
Cálculo Adaptativo de Volatilidade 📏
O sistema mede a volatilidade do mercado usando dois métodos:
- Desvio Padrão (StdDev): Método clássico de medição de dispersão
- Desvio Absoluto Médio (MAD): Mais robusto contra valores extremos
A volatilidade calculada é suavizada e então comparada a um histórico de volatilidades passadas para determinar sua classificação percentual. Este percentil controla o multiplicador da banda:
- Baixa Volatilidade (percentil baixo): Bandas mais próximas do preço 🤏
- Alta Volatilidade (percentil alto): Bandas mais largas, dando espaço para movimento 🌐
Geração de Sinais 🔔
Os sinais são ativados quando o preço real cruza as bandas adaptativas:
- Uma vez que um sinal é ativado, o indicador mantém o status da tendência até que ocorra o cruzamento oposto, prevenindo sinais prematuros em zonas de consolidação. 🛡️
Para Que Serve? 🛠️
Identificação de Tendência 👀
O indicador colore as velas de acordo com a direção da tendência detectada, permitindo identificar rapidamente se o mercado está em uma fase de alta ou baixa. As nuvens coloridas entre as linhas filtradas reforçam visualmente a força e a direção do movimento.
Pontos de Entrada e Saída ➡️🚪
Os sinais de COMPRA/VENDA marcados com ícones proeminentes indicam momentos potenciais para entrar ou sair do mercado. Esses sinais buscam capturar o início das tendências quando o preço mostra impulso suficiente para superar as bandas adaptativas.
Gestão de Posição 💼
As bandas superior e inferior atuam como níveis de referência para:
- Determinar stops dinâmicos
- Identificar zonas relativas de sobrecompra/sobrevenda 🏷️
- Avaliar se uma tendência está perdendo força (preço retraindo em direção à linha central) 📉


