
Описание
Индикаторы Pinescriptlabs Store: 🤖Pinescriptlabs Store cBots : (cBot) Gold & BTC BreakoutSession Pivots(новый)
Карта Ликвидации Кредитного Плеча
Прогноз на основе Linreg & ATR
SmartTrend Поддержка и
Сопротивление
Линии
Сессии Разрыва Справедливой Ценности
Динамический
Анализ Структуры
Рынка
Поворотных
Точек
Точек
Фибоначчи
Линейная
Регрессия
Мульти-таймфрейм
Импульсный Разрыв Справедливой Ценности
Многоуровневый
Отслеживатель Смещения Свечей
Трекер
Авто
Линии Поддержки и
Сопротивления
Тренда
Линии
Все
Уровни Поддержки и
Сопротивления
Уровни
Динамический Импульс Диапазона
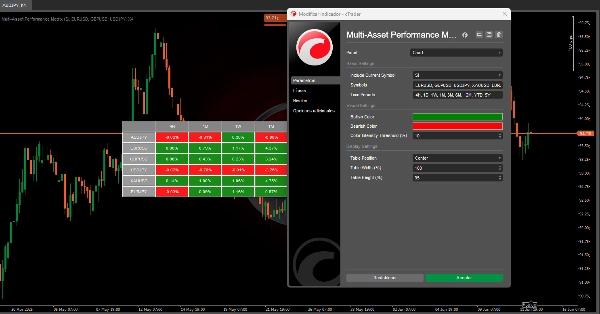
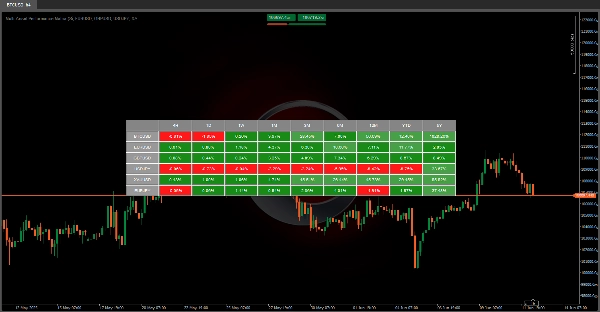
🚀 МАТРИЦА ЭФФЕКТИВНОСТИ МУЛЬТИ-АКТИВОВ 🚀
Этот алгоритм является мощным визуальным инструментом 📊, предназначенным для отображения процентной эффективности нескольких финансовых инструментов за разные периоды времени.
Он преобразует исторические данные в эффективную и интуитивно понятную визуализацию, позволяя пользователям быстро оценить поведение различных финансовых активов.
❓ Что делает этот инструмент?
1️⃣ 📈 Сравнивает Активы: Показывает, как менялись цены различных финансовых инструментов (например, BTCUSD, EURUSD, XAUUSD и др.) с течением времени.
- Таймфреймы: D (Дневной) | 1W (Недельный) | 1M (Месячный) | 3M (Квартальный) | 6M (Полугодовой) | 12M (Годовой) | YTD (С начала года) | 5Y (Последние 5 лет)
2️⃣ 🎨 Выделяет Тренды: Использует цветовое кодирование (🟢, 🔴 ) для мгновенного определения, какие активы растут или падают в каждом периоде.
3️⃣ ⏱️ Автообновление: Обновляет данные каждую минуту для отражения самой свежей информации с рынка.
💡 Почему это полезно?
✔ 📊 Сравнительный анализ: Позволяет сравнивать несколько активов бок о бок — идеально для управления портфелем или выбора лучших активов по временным горизонтам.
✔ 🛡️ Контроль: Оценка стабильности (или волатильности) актива за разные периоды помогает оценить связанные риски.
✨ Ключевые моменты
✅ ⏳ Экономит время: Ручной сбор и расчет этих данных занял бы часы— этот инструмент делает это мгновенно!
✅ 👀 Визуальная ясность: Система цветового кодирования облегчает анализ, даже для не технических пользователей.
✅ 🔄 Адаптивность: Поддерживает пользовательские символы, чтобы вы могли отслеживать важные для вас активы.
Сводка
Отзывы покупателей
5 | 100 % | |
4 | 0 % | |
3 | 0 % | |
2 | 0 % | |
1 | 0 % |


