
Описание
ДОСТУПНА ОБНОВЛЕННАЯ ВЕРСИЯ — ЗДЕСЬ
Выпущена обновленная версия этого индикатора с критическими исправлениями и улучшениями:
- Исправлено распределение объема: Пропорциональное распределение на основе перекрытия свечей (вместо 100% на все затронутые уровни)
- Исправлено определение VAH/VAL: Допуск теперь масштабируется в зависимости от высоты уровня, а не задан жестко
- Исправлено позиционирование текста: Динамические смещения на основе таймфрейма вместо жестко заданных дней
- Параметр смещения часового пояса: Для профилей DateTime
- Параметр позиции текста: Опция размещения слева/справа для режима просмотра назад
- Улучшение производительности: Бинарный поиск для поиска DateTime, кэшированные вычисления объема, оптимизированные операции со словарями
__________________________________________________________________________________________
ВАЖНЫЕ ЗАМЕТКИ - ЧИТАЙТЕ СНАЧАЛА
Объем на Forex — не реальный объем
Объем на форекс — это тик-объем — он считает, сколько раз менялась цена. Он НЕ учитывает, сколько денег было торговано.
Что тик-объем не может показать
- Размер сделки. Сделка на $100 и сделка на $10 000 000 считаются за 1 тик.
- Реальный денежный поток. Вы не видите, двигают ли цену крупные или мелкие деньги.
- Истинную ликвидность. Вы не видите, сколько ордеров ожидает на рынке.
- Активность банков. Банки видят реальные данные объема. Вы — нет.
Что это значит
Тик-объем показывает только, как часто менялась цена — а не деньги за ней. Это создает проблемы:
- Вы не можете отслеживать банки или учреждения. Они используют реальные данные объема, к которым у вас нет доступа.
- Вы не можете подтвердить теории «умных денег». Для этого нужны реальные объемы, а не подсчет тиков.
- Вы не можете оценить истинную ликвидность. Активность тиков не показывает глубину ордеров или реальную силу рынка.
- Вы не можете измерить реальную покупательскую или продавательскую силу. Многие мелкие сделки выглядят так же, как одна крупная институциональная сделка.
- Всплески объема могут быть ложными. Всплеск может быть просто алгоритмическим шумом, а не реальным интересом к торговле.
Как правильно использовать этот индикатор
- Рассматривайте его как индикатор активности, а не денег. Высокий тик-объем = рынок занят. Низкий тик-объем = рынок тихий. Ничего больше.
- Сравнивайте активность в разное время. Используйте, чтобы увидеть: сессия Лондона активнее Нью-Йорка? Сегодня активнее вчера? Период тренда активнее консолидации?
- Комбинируйте с ценовой структурой. Используйте уровни поддержки/сопротивления, точки разворота или BOS/ChoCH вместе с объемом. Контекст цены предотвращает ложные сигналы от шумных всплесков объема.
- Следите за активностью на важных ценовых уровнях. Когда цена тестирует ключевой уровень и тик-объем растет, это значит, что больше трейдеров активны. Это НЕ значит, что задействованы крупные игроки.
- Не думайте, что он показывает институциональную активность. Тик-объем не показывает накопление, крупные ордера или «умные деньги». Используйте только для измерения ритма и темпа.
__________________________________________________________________________________________
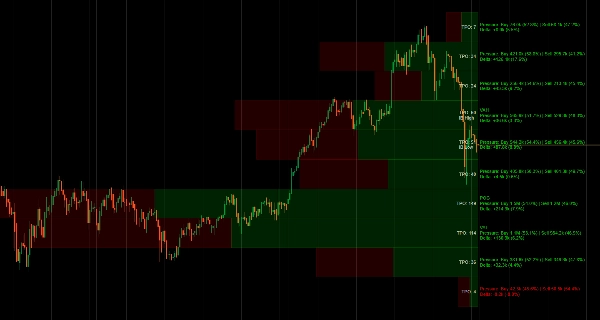
Визуализируйте распределение объема и время, проведенное на цене, с помощью отслеживания POC, Value Area и Market Profile TPO.
Этот индикатор показывает распределение объема с использованием концепций Market Profile. Он отображает Point of Control (уровень с наибольшей активностью тиков), границы Value Area (где происходило большинство торгов), последовательности букв TPO (время, проведенное на каждой цене) и визуализацию дельты, которая разделяет активность тиков по направлению свечи.
Вы можете выбирать периоды просмотра назад или задавать конкретные диапазоны дат, отображать объемные бары пропорционально или на всю ширину, переключаться между всеми уровнями или только ключевыми, а также настраивать цвета для бычьей/медвежьей активности.
ОСОБЕННОСТИ
Анализ распределения объема
- Point of Control (POC): уровень цены с наибольшей активностью — где цена провела больше всего времени
- Value Area (VA): настраиваемая зона концентрации активности (по умолчанию 70%) — где происходило большинство торгов
- VAH/VAL: границы Value Area High/Low — потенциальные уровни поддержки/сопротивления
- Визуализация дельты: разделенные бары показывают направление свечи на каждом ценовом уровне
Market Profile TPO
- Отслеживание Time Price Opportunity: подсчет количества периодов времени, торгуемых на каждой цене
- Буквы TPO: визуальное представление времени, проведенного на цене (последовательность A-Z)
- Initial Balance (IB): диапазон первого часа — важен для структуры дневной торговли
- Маркировка High/Low IB: экстремумы начального диапазона
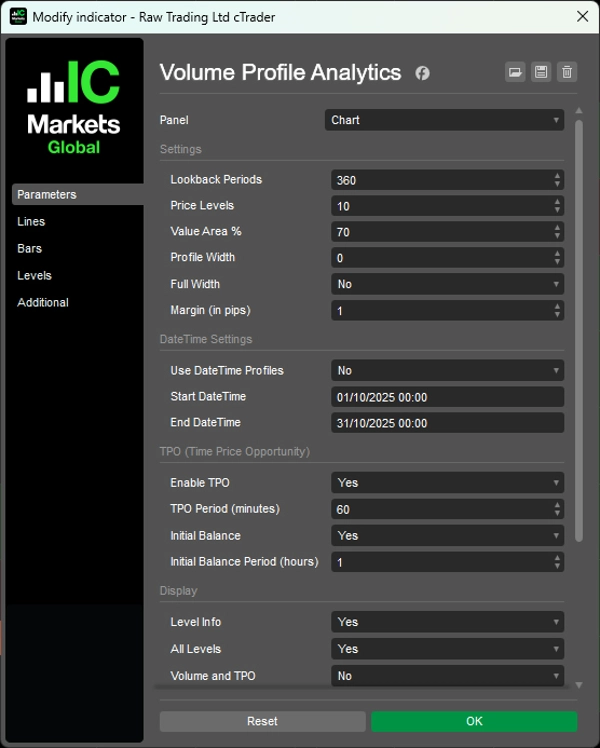
Гибкие опции просмотра назад
- На основе периода: задайте количество баров для анализа (например, последние 120 баров)
- Диапазон DateTime: закрепите профиль между конкретными датами/временем для анализа событий
- Динамическая ширина: автмасштабирование или фиксированная ширина профилей
Опции отображения
- Объемные бары: пропорциональная ширина (масштабируемая по активности) или полноширинные равномерные бары
- Разделение направления свечи внутри каждого бара
- Вычисления дельты с процентами
- Переключение между всеми уровнями или только ключевыми (POC, VAH, VAL)
- Контроль видимости деталей объема/TPO
- Направленное распределение с процентами
- Регулируемый размер шрифта и отступы на основе пипсов
Настройка цветов
- Отдельные цвета для баров с бычьим/медвежьим направлением
- Отдельные цвета текста для положительной/отрицательной дельты
- Специфический цвет текста для TPO
Оптимизация производительности
- Кэшированные временные поиски и эффективное рисование прямоугольников
- Минимальные перерасчеты для плавной работы
- Профессиональный расчет дельты на основе структуры свечей
__________________________________________________________________________________________
БОЛЬШЕ БЕСПЛАТНЫХ ИНДИКАТОРОВ
Изучайте широкий спектр инструментов анализа рынка — от структуры и объема до регрессии, волатильности и пользовательских таймфреймов.
Исходный код доступен в репозитории на GitHub repository.
Все бесплатно для использования. Но если хотите поддержать кофе, можете отправить поддержку здесь.
Поддержка/Сопротивление
Объем
- Volume Activity Profiler
- Volume Efficiency Analyzer
- Volume Profile Analytics
- Volume Profile - Updated
- Volume Spread Analysis
- VWAP (Volume Weighted Average Price)
Скользящие средние
- Anchored Moving Average
- Deviation-Scaled Moving Average
- Instantaneous Trendline
- Kaufman Adaptive MA with Trend Vision
- Moving Average Channel
- Moving Averages Suite
- Trend Channel Moving Average
Утилиты/Пользовательские
Регрессионные
Волатильность
Осцилляторы
__________________________________________________________________________________________
ОТКАЗ ОТ ОТВЕТСТВЕННОСТИ
Торговля связана с риском. Этот индикатор предназначен только для технического анализа — всегда применяйте надлежащее управление рисками и торгуйте ответственно.
ОБРАТНАЯ СВЯЗЬ И УЛУЧШЕНИЯ
Если у вас есть предложения, запросы функций или идеи для улучшения, пожалуйста, оставьте комментарий во вкладке Обсуждение. Ваш отзыв помогает улучшить индикатор для всех.
Сводка
Users can customize lookback periods by number of bars or specific date/time ranges and choose between proportional or full-width volume bars. The indicator also provides delta visualization, splitting tick activity by candle direction with percentage breakdowns, and offers extensive display and color customization options for bullish and bearish activity.
This tool is optimized for performance with cached calculations and efficient drawing methods. It is designed to measure market activity rhythm and tempo based on tick volume, which counts price changes but does not represent actual traded money or liquidity. It is suitable for analyzing volume distribution and market structure across various trading sessions and timeframes.
Отзывы покупателей
5 | 100 % | |
4 | 0 % | |
3 | 0 % | |
2 | 0 % | |
1 | 0 % |


