
Reactive Moving Average
อินดิเคเตอร์
261 ดาวน์โหลด
เวอร์ชัน 1.0, Jan 2025
Windows, Mac
5.0
รีวิว: 1
คำอธิบาย
📈 ค่าเฉลี่ยเคลื่อนที่สัญญาณ 📉
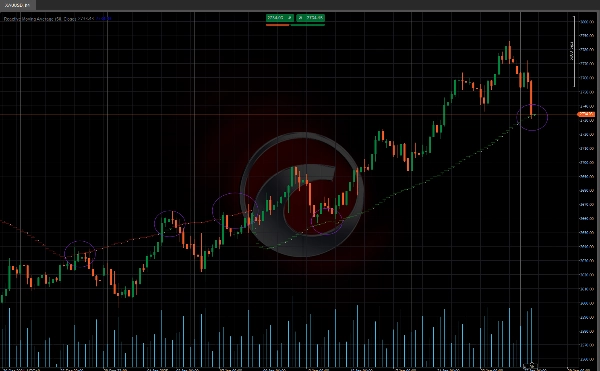
ค่าเฉลี่ยเคลื่อนที่สัญญาณ Signal Moving Average เป็นตัวบ่งชี้ที่รวมค่าเฉลี่ยเคลื่อนที่ง่าย (Simple Moving Average - SMA) กับการคำนวณความสัมพันธ์แบบไดนามิกเพื่อปรับตัวให้เข้ากับสภาวะตลาดได้ดีขึ้น 🎯 ตัวบ่งชี้นี้ปรับความไวตามความแข็งแกร่งของแนวโน้ม ทำให้เป็นเครื่องมือที่ทรงพลังสำหรับการระบุแนวโน้มและกรองเสียงรบกวนในตลาด 🌟
คุณสมบัติหลัก 🔑
📊 ค่าเฉลี่ยเคลื่อนที่ที่ปรับแล้ว:
- เส้นค่าเฉลี่ยเคลื่อนที่จะปรับแบบไดนามิกตามความสัมพันธ์ระหว่างราคาและเวลา
- ในตลาดที่มีแนวโน้มแข็งแกร่ง ค่าเฉลี่ยเคลื่อนที่จะเคลื่อนที่เร็วขึ้นเพื่อติดตามราคา 🚀
- ในตลาดที่เคลื่อนไหวแบบด้านข้าง ค่าเฉลี่ยเคลื่อนที่จะคงที่มากขึ้นเพื่อลดสัญญาณเท็จ 🛑
🔢 การคำนวณความสัมพันธ์:
- ตัวบ่งชี้คำนวณความสัมพันธ์ระหว่างราคาและเวลาโดยใช้ สูตรเพียร์สัน.
- มันปรับค่าเฉลี่ยเคลื่อนที่ตาม สัมประสิทธิ์การกำหนด (R²). 🧮
👀 การแสดงผล:
- การแสดงผลที่ชัดเจนและเข้าใจง่าย 📉📈
วิธีใช้ตัวบ่งชี้ 🛠️
🔍 การระบุแนวโน้ม:
- แนวโน้มขาขึ้น: เมื่อราคาสูงกว่าค่าเฉลี่ยเคลื่อนที่ที่สัมพันธ์กัน 🐂
- แนวโน้มขาลง: เมื่อราคาต่ำกว่าค่าเฉลี่ยเคลื่อนที่ที่สัมพันธ์กัน 🐻
✅ การยืนยันสัญญาณ:
- ใช้ค่าเฉลี่ยเคลื่อนที่ที่ปรับแล้วเป็นระดับสนับสนุนหรือแนวต้านแบบไดนามิก 🛡️
- ผสมผสานตัวบ่งชี้นี้กับเครื่องมือทางเทคนิคอื่นๆ เพื่อยืนยันสัญญาณ 🔄
การปรับค่าเฉลี่ยเคลื่อนที่ ⚙️
อัลกอริทึมปรับค่าเฉลี่ยเคลื่อนที่ตามค่าของ R²:
- ถ้า R² > 0.5 (ความสัมพันธ์ที่มีนัยสำคัญ):
-
- ค่าเฉลี่ยเคลื่อนที่จะถูกปรับโดยใช้การผสมแบบถ่วงน้ำหนักระหว่างค่าปัจจุบันของ SMA และค่าก่อนหน้าของค่าเฉลี่ยเคลื่อนที่ที่ปรับแล้ว (_ma)
- น้ำหนักขึ้นอยู่กับค่าของ R². ⚖️
- ถ้า R² ≤ 0.5 (ความสัมพันธ์ที่ไม่มีนัยสำคัญ):
-
- ค่าเฉลี่ยเคลื่อนที่จะถูกปรับโดยการลบค่าที่สัดส่วนกับความแตกต่างสัมบูรณ์ระหว่างค่าปัจจุบันของ SMA และค่าก่อนหน้าของค่าเฉลี่ยเคลื่อนที่ที่ปรับแล้ว 🔄
- ตัวบ่งชี้ร้านค้า Ctrader:
โครงสร้างตลาดไดนามิก
การวิเคราะห์จุดเปลี่ยน
ฟีโบนักชีเชิงเส้น
การถดถอยหลายกรอบเวลา
ช่องว่างมูลค่ายุติธรรมโมเมนตัม
ความลำเอียงเทียนหลายระดับ
ตัวติดตาม
สรุป
สรุปโดย AI
The Reactive Moving Average is a technical indicator that integrates a Simple Moving Average (SMA) with a dynamic correlation calculation to adapt to changing market conditions. It adjusts its sensitivity based on the strength of the trend, enhancing trend identification and reducing market noise.
Key functionalities include:
- **Adjusted Moving Average**: The moving average line dynamically adapts according to the correlation between price and time. It accelerates in strong trending markets to closely follow price movements and stabilizes in sideways markets to minimize false signals.
- **Correlation Calculation**: Utilizes the Pearson formula to compute the correlation between price and time, adjusting the moving average based on the coefficient of determination (R²).
- **Moving Average Adjustment**: When R² is greater than 0.5, the moving average is updated using a weighted combination of the current SMA and the previous adjusted value, with weights depending on R². For R² less than or equal to 0.5, adjustments are made by subtracting a value proportional to the difference between the current SMA and prior adjusted average.
- **Visualization**: Provides a clear and intuitive display for easy interpretation.
Usage involves identifying bullish trends when price is above the adjusted moving average and bearish trends when below. The indicator can also serve as a dynamic support or resistance level and be combined with other technical tools for signal confirmation.
โปรไฟล์อินดิเคเตอร์
รีวิวจากลูกค้า
5.0
รีวิว: 1
5 | 100 % | |
4 | 0 % | |
3 | 0 % | |
2 | 0 % | |
1 | 0 % |
รีวิวจากลูกค้า
August 12, 2025
Pros: Adaptive moving average combining SMA with dynamic correlation to reduce lag and smooth price noise. Flexible sensitivity settings. Cons: No alerts or tooltips. No template saving. Can produce noise on low-end PCs or very short timeframes.
การสนทนา
คำถามที่พบบ่อย
Signal
Breakout
Supertrend
RSI
ผลิตภัณฑ์ที่มีให้บริการผ่าน cTrader Store รวมถึงบอทการเทรด อินดิเคเตอร์ และปลั๊กอิน มีให้บริการโดยนักพัฒนาบุคคลที่สามและมีไว้เพื่อวัตถุประสงค์ในการเข้าถึงข้อมูลและทางเทคนิคเท่านั้น cTrader Store ไม่ใช่โบรกเกอร์และไม่ได้ให้คำแนะนำการลงทุน คำแนะนำส่วนบุคคล หรือการรับประกันผลการดำเนินงานในอนาคต


ราคา
ตั้งแต่ 03/10/2024
163
การขาย
38.39K
ติดตั้งฟรี