คำอธิบาย
Pinescritlabs
ตัวบ่งชี้ร้านค้า Ctrader: 🤖Pinescritlabs Ctrader Store cBots:
Fair Value Gap Sessions Gold & BTC Breakout Session Pivots
Dynamic Market Structure
การวิเคราะห์จุดเปลี่ยน
Fibonacci Linear
การถดถอยหลายกรอบเวลา
Multi-Level Candle Bias
Tracker
Auto Support and
Resistance Trend Lines
All Support and
Resistance Levels
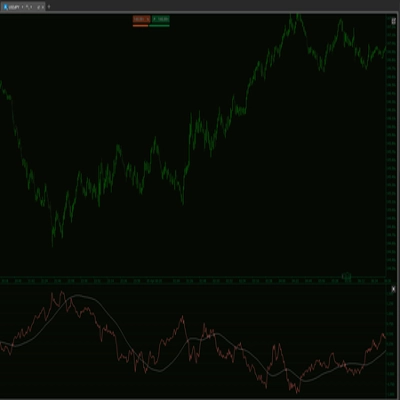
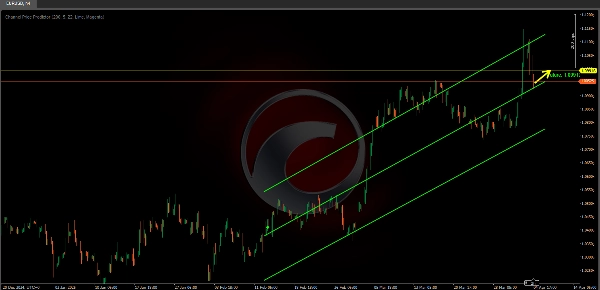
The Channel Price Predictor ระบุและวาดช่องแนวโน้ม (ไม่ว่าจะเป็น ขาขึ้น หรือ ขาลง) บนกราฟ โดยขยายไปในอนาคตเพื่อคาดการณ์โซนราคาที่เป็นไปได้ 📈🔮
ช่องนี้อิงตาม ATR (Average True Range) ซึ่งวัดความผันผวนของตลาด ยิ่งความผันผวนล่าสุดสูง ช่องก็จะกว้างขึ้น ช่วยให้เห็นช่วงของการเคลื่อนไหวที่น่าจะเป็นไปได้ 📊💥
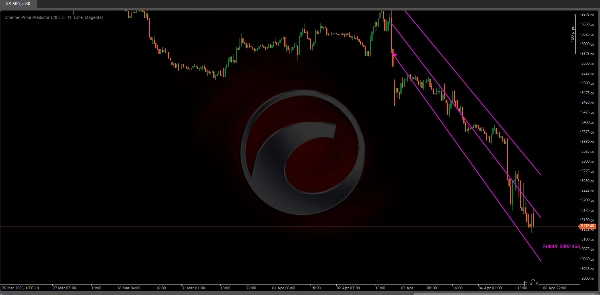
มันระบุและวาดช่องโดยอัตโนมัติจากจุดสูงและต่ำของ pivot
ตัวเลือกในการขยายเส้นช่องและคาดการณ์ราคาของพวกมันในอนาคต 🕒📉
ช่องนี้ไม่เพียงแสดงการเคลื่อนไหวปัจจุบันเท่านั้น แต่ยังให้การประมาณการราคาสำหรับอนาคตผ่านป้ายกำกับ (“Future: …”) ที่แสดงค่าราคาที่เป็นไปได้ 📅💡
มันใช้ทำอะไร?
การระบุแนวโน้ม:
ตัวบ่งชี้ใช้ตรรกะภายในเพื่อตรวจจับเมื่อตลาดเปลี่ยนจาก ขาขึ้น เป็น ขาลง (หรือในทางกลับกัน) ด้วยวิธีนี้ คุณจะเห็นภาพได้ชัดเจนขึ้นว่า สินทรัพย์อยู่ในช่วง ขาขึ้น หรือ ขาลง 📈🔄📉
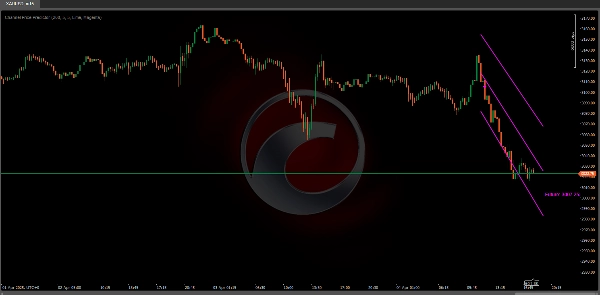
ช่องความผันผวน:
ช่องนี้อิงตาม ATR (Average True Range) ซึ่งวัดความผันผวน ยิ่งความผันผวนล่าสุดสูง ช่องก็จะกว้างขึ้น ช่วยให้คุณเห็น ช่วงของการเคลื่อนไหวที่น่าจะเป็นไปได้ 📊🔍
การคาดการณ์ในอนาคต:
ตัวบ่งชี้ไม่เพียงแสดงแนวโน้มปัจจุบัน แต่ยังขยายช่องไปข้างหน้าหลายช่วงเวลา (ปรับได้) เพื่อให้คุณคาดการณ์โซน แนวรับ/แนวต้าน ภายในแนวโน้มนั้น ⏳🚀
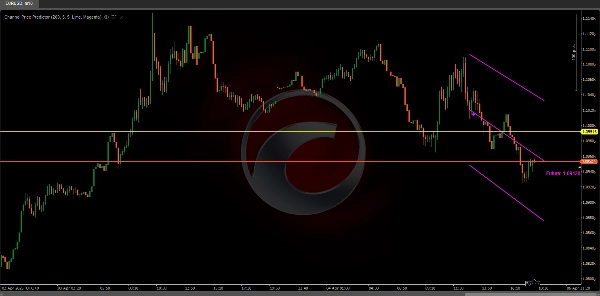
มันอนุญาตให้คุณขยายเส้นช่องและคาดการณ์ราคาของพวกมันในอนาคต ⬆️⬇️
การอ้างอิงราคา:
โดยการวาดเส้นกลางและขอบบนล่าง มันให้การอ้างอิงสำหรับวางจุดหยุด ข้อกำหนดเป้าหมาย หรือแม้แต่จัดการ การเข้า/ออก ด้วยข้อมูลเพิ่มเติมเกี่ยวกับความผันผวน 🎯📍
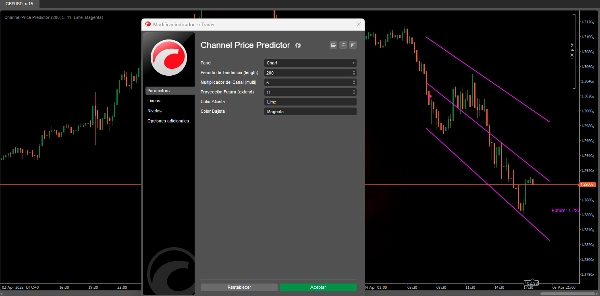
เนื่องจากข้อจำกัดของ cTrader ขณะนี้ไม่สามารถเลื่อนกราฟไปทางขวาเพื่อดูการขยายช่องในอนาคตได้อย่างถูกต้อง
แนะนำให้ตั้งค่าพารามิเตอร์ “Future Projection” เป็นค่าน้อยกว่า 25 ช่วงเวลาเพื่อหลีกเลี่ยงปัญหาการแสดงผล
เมื่อ cTrader เพิ่มความสามารถในการขยายกราฟไปในอนาคต เราจะปรับปรุงอัลกอริทึมเพื่อใช้ประโยชน์จากฟังก์ชันนี้อย่างเต็มที่
สรุป
Key features include automatic detection of trend direction changes, visualization of current trend channels, and the ability to extend channel lines into the future. This future projection helps anticipate potential support and resistance zones by displaying estimated price values labeled as “Future: …”. The indicator draws a central line along with upper and lower channel boundaries, providing reference points for placing stops, targets, and managing trade entries and exits with volatility context.
Users can configure the number of periods for future projection, with a recommended maximum of 25 periods to avoid display issues due to cTrader platform limitations. The indicator supports analysis of various markets including cryptocurrencies (e.g., BTCUSD), commodities (e.g., XAUUSD), and others where volatility and trend identification are relevant.
รีวิวจากลูกค้า
5 | 100 % | |
4 | 0 % | |
3 | 0 % | |
2 | 0 % | |
1 | 0 % |