Descrição
🔥 Pinescritlabs
Indicadores da Ctrader Store: 🤖cBots da Pinescritlabs Ctrader Store:
Fair Value Gap Sessions Gold & BTC Breakout Session Pivots
Dynamic Market Structure
Análise de Pontos de Virada
Fibonacci Linear
Regressão Multi-temporal
Multi-Level Candle Bias
Tracker
Auto Support and
Resistance Trend Lines
All Support and
Resistance Levels
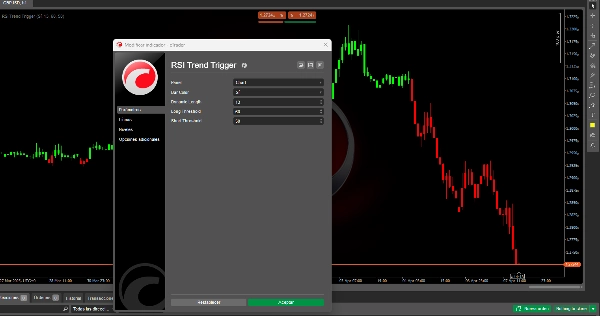
RSI Trend Trigger 📈✨
Como Funciona? 🤔
Passo 1: RSI Tradicional
O padrão Índice de Força Relativa (RSI) é calculado, medindo a velocidade e a magnitude dos movimentos de preço ao longo de um período definido. Ele oscila entre 0 e 100, identificando condições de sobrecompra (por exemplo, acima de 70) e sobrevenda (por exemplo, abaixo de 30). 📊📉📈
Passo 2: Refinamento Dinâmico
O RSI tradicional passa por um processo avançado de suavização:
- Uma segunda cálculo matemático é aplicado aos valores originais do RSI (não ao preço em si).
- Esta etapa cria uma versão mais estável do RSI, reduzindo flutuações menores (ruído de mercado) e destacando tendências genuínas.
- Ao contrário da suavização básica, este método preserva a capacidade de resposta a mudanças significativas de momentum, evitando atrasos excessivos. 🛡️🔄
Por Que o Refinamento é Importante? 🤩
- Filtragem Inteligente: Elimina sinais falsos causados por volatilidade temporária, como picos de notícias ou movimentos especulativos. �🗑️
- Tendências Mais Nítidas: A abordagem de dupla cálculo distingue entre correções menores e reversões reais de tendência. 🎯
- Sinais Persistentes: Uma vez que uma tendência (de alta/baixa) é confirmada, o indicador a mantém até que ocorra uma reversão clara, evitando saltos erráticos de sinal. 🔒
Uso Prático: Limiares e Tomada de Decisão 📈
O RSI refinado combina com dois limiares ajustáveis:
- Limiar de Alta (ex.: 60):
-
- Se o RSI refinado ultrapassar este nível, uma tendência de alta é confirmada. 🚀
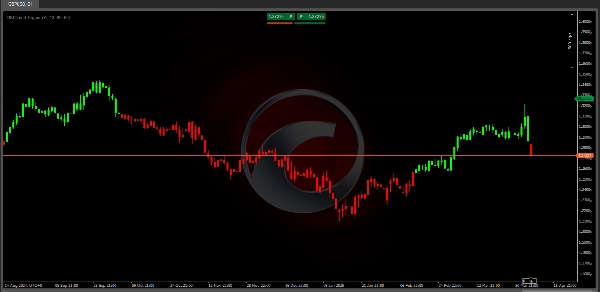
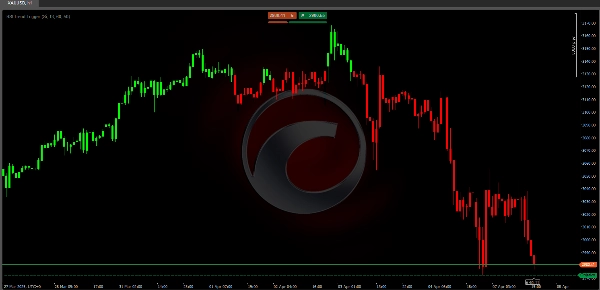
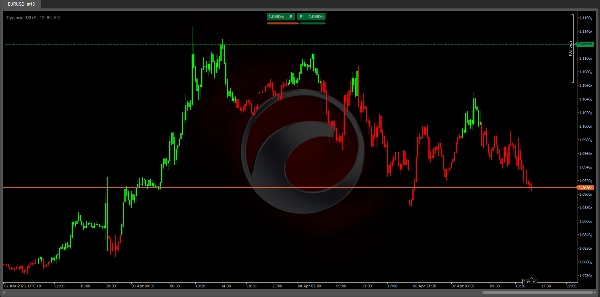
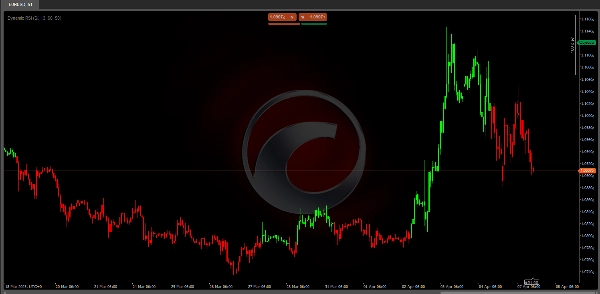
- As velas ficam verdes
- Limiar de Baixa (ex.: 50):
-
- Se o RSI refinado cair abaixo deste nível, uma tendência de baixa é acionada. 📉
- As velas ficam vermelhas
Regra Principal:
- Sinais aparecem apenas durante mudanças de tendência (não em toda flutuação), reduzindo sobrecarga de informação. 🚫📢
- Os limiares são personalizáveis: use valores mais altos (ex.: 65/55) para mercados voláteis ou valores mais baixos (ex.: 55/45) para tendências mais suaves. ⚙️
Benefícios para Traders 🏆
- Precisão Aprimorada:
-
- Menos sinais falsos graças ao filtro de dupla camada. Ideal para mercados laterais ou falsos rompimentos. ✅
- Visualização Intuitiva:
-
- Velas coloridas e limiares visuais permitem identificar tendências instantaneamente. 👀🎨
- Adaptabilidade:
-
- Funciona em diversos ativos (forex, ações, cripto) e prazos (minutos a semanas). 🌍⏳
- Negociação Focada em Tendência:
-
- Ajuda a negociar com o momentum, evitando movimentos contrários arriscados. 🎯🚦
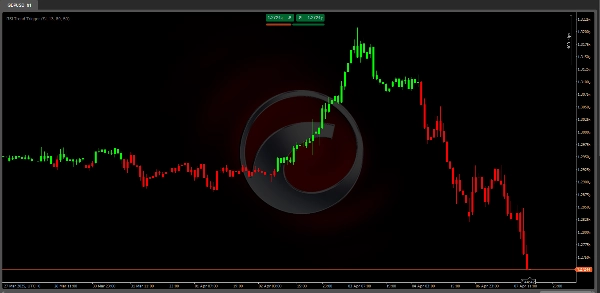
Exemplo de Fluxo de Sinal
Imagine que o RSI refinado está em 55 (zona neutra):
- Cenário de Alta: Sobe para 62 → Ultrapassa o limiar 60 → Velas ficam verdes🚀
- Cenário de Baixa: Cai para 48 → Rompe o limiar 50 → Velas ficam vermelhas📉
Resumo
The indicator then applies an advanced smoothing process to the RSI values, not the price data, creating a refined RSI that reduces minor market noise while maintaining sensitivity to significant momentum changes. This dual-layer calculation enhances signal precision by filtering out false signals caused by temporary volatility and distinguishing between minor corrections and genuine trend reversals.
Users can customize two threshold levels—a bullish threshold (e.g., 60) and a bearish threshold (e.g., 50)—to define when a trend is confirmed. When the refined RSI crosses above the bullish threshold, the indicator signals a bullish trend with green candles; when it falls below the bearish threshold, it signals a bearish trend with red candles. Signals appear only during trend changes, reducing information overload.
The RSI Trend Trigger supports multiple timeframes from minutes to weeks and is adaptable to different market conditions, aiding traders in aligning with momentum and avoiding counter-trend risks.
Avaliações de clientes
5 | 67 % | |
4 | 33 % | |
3 | 0 % | |
2 | 0 % | |
1 | 0 % |


![Logótipo de "[Stellar Strategies] Inside Bar with Signals"](https://cdn.ctrader.com/image/webp/1d9e8bfa-3b2c-4440-bb37-5856902008a7_30683)