
Reactive Moving Average
指标
261 下载
版本 1.0, Jan 2025
Windows 版、Mac 版
5.0
评价:1
说明
📈 信号移动平均线 📉
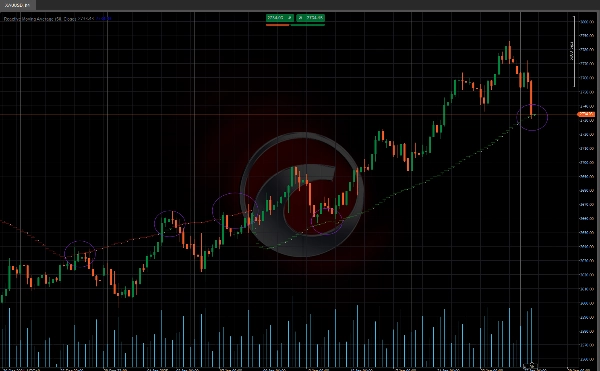
信号移动平均线 是一种结合了 简单移动平均线 (SMA) 与动态相关性计算的指标,以更好地适应市场状况。🎯 该指标根据趋势强度调整其敏感度,使其成为识别趋势和过滤市场噪音的强大工具。🌟
主要特征 🔑
📊 调整后的移动平均线:
- 移动平均线根据价格与时间之间的相关性动态调整。
- 在强趋势市场中,移动平均线移动更快以跟随价格。🚀
- 在横盘市场中,移动平均线保持更稳定,减少假信号。🛑
🔢 相关性计算:
- 该指标使用 Pearson 公式 计算价格与时间之间的相关性。
- 它根据 决定系数 (R²) 调整移动平均线。🧮
👀 可视化:
- 清晰直观的显示,便于解读。📉📈
如何使用该指标 🛠️
🔍 趋势识别:
- 看涨趋势:当价格位于相关移动平均线之上。🐂
- 看跌趋势:当价格位于相关移动平均线之下。🐻
✅ 信号确认:
- 将调整后的移动平均线用作动态支撑或阻力位。🛡️
- 将该指标与其他技术工具结合使用以确认信号。🔄
移动平均线调整 ⚙️
算法根据 R² 的值调整移动平均线:
- 如果 R² > 0.5(显著相关):
-
- 移动平均线通过当前 SMA 值与调整后移动平均线 (_ma) 之前值的加权组合进行调整。
- 权重取决于 R² 的值。⚖️
- 如果 R² ≤ 0.5(非显著相关):
-
- 移动平均线通过减去与当前 SMA 值与调整后移动平均线之前值的绝对差成比例的值进行调整。🔄
- Ctrader 商店指标:
摘要
AI 摘要
The Reactive Moving Average is a technical indicator that integrates a Simple Moving Average (SMA) with a dynamic correlation calculation to adapt to changing market conditions. It adjusts its sensitivity based on the strength of the trend, enhancing trend identification and reducing market noise.
Key functionalities include:
- **Adjusted Moving Average**: The moving average line dynamically adapts according to the correlation between price and time. It accelerates in strong trending markets to closely follow price movements and stabilizes in sideways markets to minimize false signals.
- **Correlation Calculation**: Utilizes the Pearson formula to compute the correlation between price and time, adjusting the moving average based on the coefficient of determination (R²).
- **Moving Average Adjustment**: When R² is greater than 0.5, the moving average is updated using a weighted combination of the current SMA and the previous adjusted value, with weights depending on R². For R² less than or equal to 0.5, adjustments are made by subtracting a value proportional to the difference between the current SMA and prior adjusted average.
- **Visualization**: Provides a clear and intuitive display for easy interpretation.
Usage involves identifying bullish trends when price is above the adjusted moving average and bearish trends when below. The indicator can also serve as a dynamic support or resistance level and be combined with other technical tools for signal confirmation.
指标配置
客户评价
5.0
评价:1
5 | 100 % | |
4 | 0 % | |
3 | 0 % | |
2 | 0 % | |
1 | 0 % |
客户评价
August 12, 2025
Pros: Adaptive moving average combining SMA with dynamic correlation to reduce lag and smooth price noise. Flexible sensitivity settings. Cons: No alerts or tooltips. No template saving. Can produce noise on low-end PCs or very short timeframes.
讨论
常见问答
Signal
Breakout
Supertrend
RSI
cTrader Store 提供的所有产品,包括交易机器人、指标和插件,均由第三方开发者提供,仅供信息参考和技术访问之用。cTrader Store 并非经纪商,不提供投资建议、个人推荐或任何未来业绩保证。


!["[Stellar Strategies] QQE" 标识](https://cdn.ctrader.com/image/webp/e702104a-874c-4b39-97dd-fb34518d1015_27712)


价格
注册日期 03/10/2024
163
销售
38.39K
免费安装