
说明
AdaptiveTrendChannel是一个帮助您更清晰、更动态地可视化市场趋势的指标。📈 与普通移动平均线不同,它实时适应价格变化,让您能够看到趋势何时发生转变。🔄
🛠️ 它是如何工作的?
它首先生成一条动态参考线,随着每根蜡烛更新。🕯️ 将这条线视为一个平衡点,告诉您价格是处于均衡区还是朝着明确方向移动。
但这条线并非孤立工作!它还依赖于内部水平,作为动态支撑和阻力。💪 这些水平根据最近的高点和低点📉📈不断调整,意味着它们不是固定的——它们实时适应市场状况。
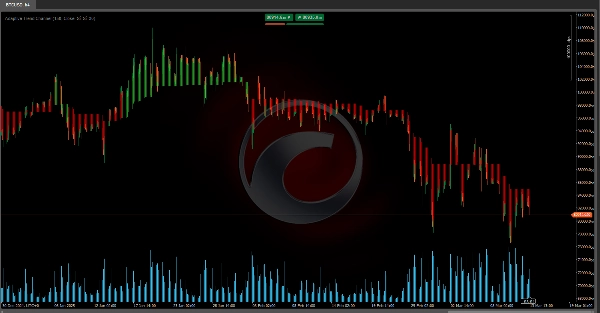
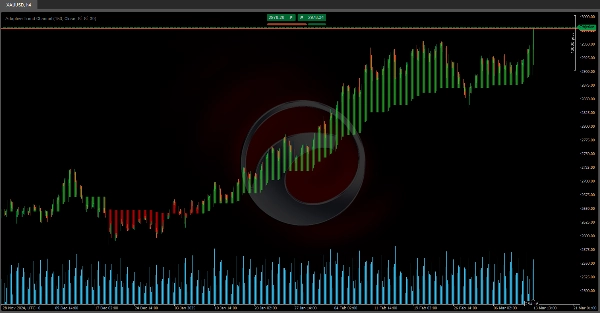
当价格突破这些动态水平的上下方时,指标检测到趋势变化并生成信号。为了让情况更清晰,它为参考线与收盘价之间的区域着色,使趋势视觉上明显。🎨👀
📌 如何在交易中使用?
那么,如何将其应用于实际交易?很简单。
✅ 如果价格在多根蜡烛中保持在参考线之上,市场被视为看涨。🟢
❌ 如果价格跌破参考线之下,市场被视为看跌。🔴
由于这条线动态调整并过滤市场噪音,它为您提供了更清晰的趋势视图。
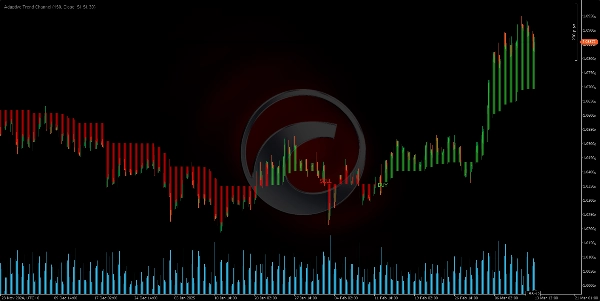
此外,指标跟踪最近的交叉点:
🔻 如果价格跌破关键内部水平,表示潜在的看跌阶段。
🔺 如果价格突破关键内部水平,表示潜在的看涨阶段。
基于这些信息,指标完成两项关键功能:
🎨 改变线条和图表区域的颜色,为您提供即时的视觉提示,显示趋势方向。
📢 在检测到趋势变化时生成买卖信号。
🔥 它为何如此强大?
AdaptiveTrendChannel帮助您站在趋势的正确一边,避免逆势交易。它突出显示关键时刻的进出场点,为您提供清晰的视觉参考,助力更智能的交易决策。
当与成交量分析或价格行为等其他工具结合使用时,它成为过滤交易和提高入场精度的强大助手。🚀💰
Ctrader 商店指标:
Dynamic Market Structure
Analysis of Turning Points
Fibonacci Linear
Regression Multi-timeframe
Multi-Level Candle Bias
Tracker
Auto Support and
Resistance Trend Lines
All Support and
Resistance Levels
摘要
When the price moves above or below these adaptive levels, the indicator detects trend changes and produces buy or sell signals. It visually highlights trends by coloring the area between the reference line and the closing price, providing clear visual cues on trend direction. Traders can interpret price staying above the reference line as bullish and below it as bearish, with the indicator filtering out market noise for a cleaner trend view.
Additionally, the Adaptive Trend Channel tracks recent crossovers of key internal levels to signal potential bullish or bearish phases. It is intended to help traders stay aligned with market momentum and identify key entry and exit points. When combined with other tools like volume analysis or price action, it supports improved trade filtering and entry precision.
客户评价
5 | 100 % | |
4 | 0 % | |
3 | 0 % | |
2 | 0 % | |
1 | 0 % |


