

Opis
PRZEGLĄD
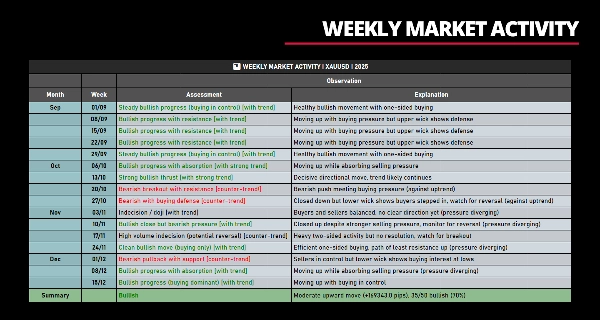
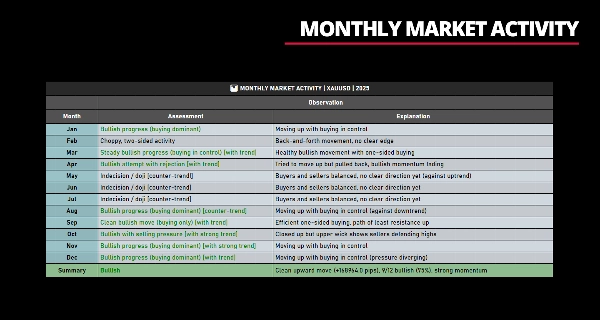
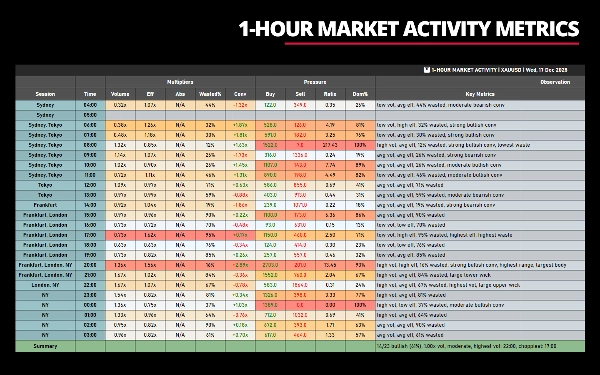
Volume Efficiency Analyzer to kompleksowe narzędzie do analizy słupkowej, które mierzy zależność między wolumenem (wysiłkiem) a ruchem cen (wynikiem). Zostało pierwotnie stworzone do użytku osobistego, aby odpowiedzieć na konkretne pytanie: „Czy rynek porusza się efektywnie, czy jest dużo aktywności bez znaczącego postępu?”
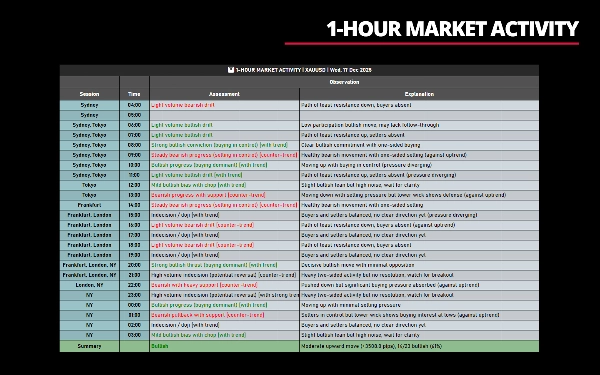
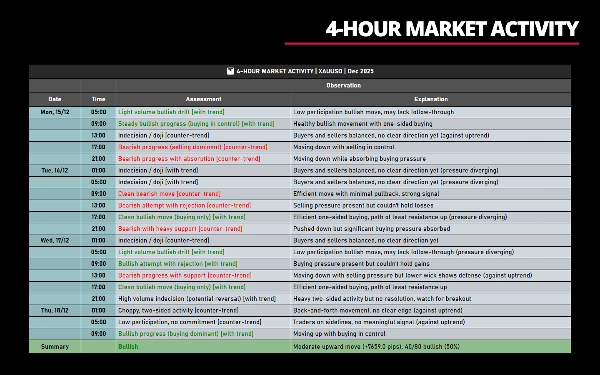
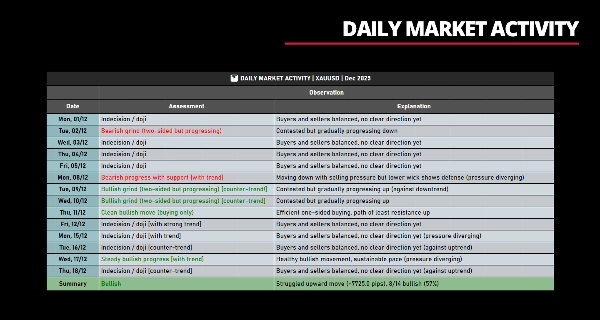
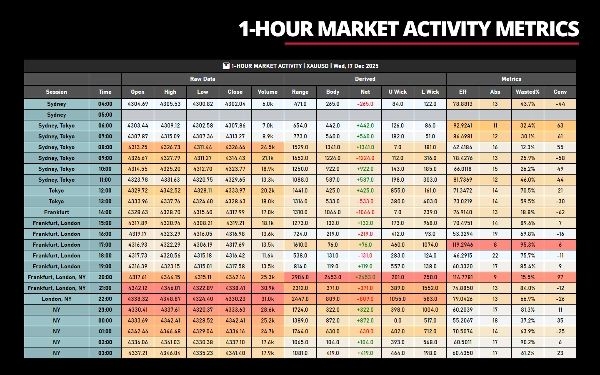
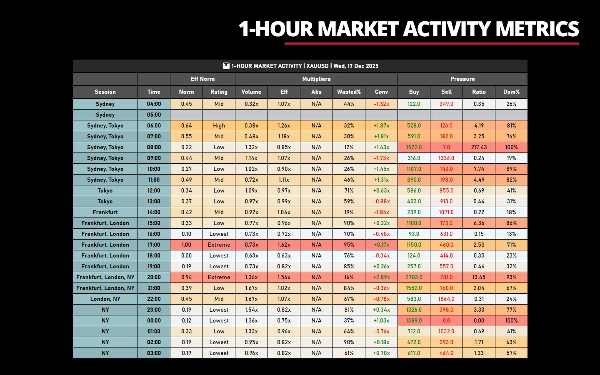
Ten wskaźnik NIE generuje żadnych wykresów. Wyświetla jedynie analizę statystyczną i metryki w formacie tabelarycznym — bez linii, sygnałów czy nakładek cenowych. Te metryki mierzą i kwantyfikują jakość oraz cechy ruchu cen i zachowania rynku, pomagając zrozumieć, czy ruchy są zdecydowane, wyczerpane, kwestionowane czy niezdecydowane —po ich wystąpieniu.
__________________________________________________________________________________________
W SKRÓCIE
Wynik: Dane statystyczne (bez wykresów)
Wyświetlanie: Format tabelaryczny
Interwały czasowe: Od poddziennego do miesięcznego
Metryki: Ponad 20 wskaźników efektywności/ciśnienia
Najlepsze do: Analizy wolumenu, oceny jakości
__________________________________________________________________________________________
GŁÓWNA KONCEPCJA: WYSIŁEK A WYNIK
Podstawowa zasada jest prosta:
- Wysiłek = Wolumen tickowy (aktywność handlowa)
- Wynik = Ruch cenowy (zakres, korpus, zmiana netto)
Efektywne rynki generują znaczny ruch cen przy rozsądnym wolumenie — ruchy są czyste i zdecydowane.
Nieefektywne rynki wykazują wysoki wolumen, ale ograniczony postęp netto — ruchy są niestabilne, kwestionowane lub absorbowane.
Mierząc tę zależność na poszczególnych słupkach i w okresach zbiorczych, możesz zidentyfikować:
- Warunki trendu vs. konsolidacji
- Zaangażowanie vs. niezdecydowanie
- Wyczerpanie vs. kontynuacja
- Rynki jednostronne vs. dwustronne
__________________________________________________________________________________________
KLUCZOWA KONFIGURACJA PARAMETRÓW
Te pięć parametrów kontroluje jakie dane wskaźnik wyświetla. Zrozumienie ich działania jest kluczowe dla efektywnego użycia.
1. Parametr Daty
Cel: Określa, którą datę/okres analizować.
Przykłady formatów:
""(pusty) – Najnowszy dzień handlowy z danymi"18/12/2025"– Konkretna data (DD/MM/RRRR)"12/2025"– Cały miesiąc (MM/RRRR)"2025"– Cały rok (RRRR)
2. Parametr Zakresu Godzin
Cel: Filtruje, które godziny wyświetlać na interwałach poddziennych.
Dotyczy: Tylko interwały poddzienne (od 1 minuty do 1 godziny)
Przykłady formatów:
""(pusty) – Pełny 24-godzinny dzień handlowy"8-16"– Od 8:00 do 16:00"08:00-16:30"– Od 8:00 do 16:30"14"– Od 14:00 do aktualnej godziny
3. Parametr Zakresu Tygodni
Cel: Filtruje, które tygodnie miesiąca wyświetlać.
Dotyczy: Tylko interwały wielogodzinne (od 2 do 12 godzin)
Przykłady formatów:
""(pusty) – Wszystkie tygodnie w miesiącu"1"– Tylko pierwszy tydzień"1,3"– Tygodnie 1 i 3"2,3,4"– Tygodnie 2, 3 i 4
4. Parametr Zakresu Miesięcy
Cel: Filtruje, które miesiące roku wyświetlać.
Dotyczy: Tylko interwały tygodniowe
Przykłady formatów:
""(pusty) – Wszystkie miesiące w roku"1"– Tylko styczeń"1,6,12"– Styczeń, czerwiec, grudzień"3,4,5,9,10,11"– Q1 (wiosna) i Q4 (jesień)
5. Parametr MaxDataRows
Cel: Ogranicza liczbę wierszy (słupków) wyświetlanych w tabeli.
Dotyczy: Wszystkie interwały czasowe
Wartość domyślna: 24
Format:
-1lub0– Pokaż wszystkie dostępne dane (bez limitu)- Dowolna liczba dodatnia – Pokaż maksymalnie tyle wierszy
__________________________________________________________________________________________
CECHY
Elastyczność
- 8 Grup Kolumn: Przełącz widoczność surowych danych, pochodnych, metryk, Eff Norm, mnożników, ciśnienia, kluczowych obserwacji, kluczowych metryk
- Wiele Interwałów: Działa na poddziennych (1m-1h), wielogodzinnych (2h-12h), dziennych, tygodniowych i miesięcznych wykresach
- Filtrowanie: Filtr zakresu czasowego (np. „8:00-16:00”), filtr tygodni (np. „1,3”), filtr miesięcy (np. „1,6,12”)
- Maksymalna liczba wierszy: Ogranicz wyświetlanie do najnowszych N okresów lub wokół formującego się słupka
- Podświetlanie kolorami: Opcjonalne gradientowe podświetlanie dowolnej grupy kolumn na podstawie wybranej metryki
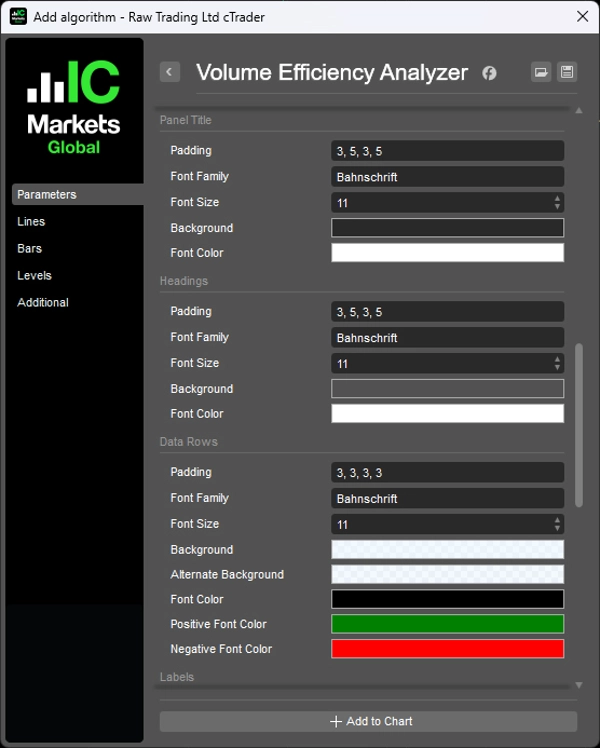
- Dostosowywalny styl: Pełna kontrola nad czcionkami, kolorami, paddingiem, szerokością kolumn
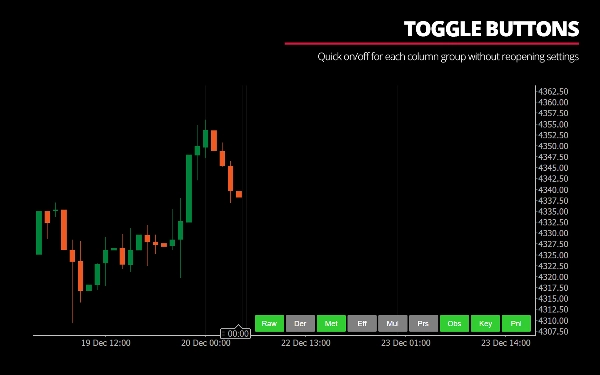
- Przyciski przełączania: Szybkie włączanie/wyłączanie każdej grupy kolumn bez ponownego otwierania ustawień
Obsługa Strefy Czasowej
- Dostosowuje czas serwera brokera względem lokalnego czasu
- Konfigurowalne godziny rozpoczęcia sesji (Sydney, Tokio, Frankfurt, Londyn, NY)
- Godzinowy start dnia handlowego (np. 4:00 dla traderów sesji azjatyckiej)
Optymalizacje Wydajności
- Wyszukiwanie binarne dla efektywnego odnajdywania słupków
- Jednoprzebiegowe obliczenia min/max do podświetlania
- Limit 500 ms na aktualizacje w czasie rzeczywistym, aby zapobiec opóźnieniom
- Podpowiedzi wyszukiwania, aby unikać zbędnych zapytań
__________________________________________________________________________________________
ZROZUMIENIE METRYK
Co czyni ruch dobrym?
- Wysoka efektywność: Przemieszczony daleko przy małym wolumenie
- Niski % strat: Minimalne knoty, czyste korpusy kierunkowe
- Zgodne ciśnienie: Dominacja presji kupna przy zamknięciach wzrostowych (lub odwrotnie)
- Silne przekonanie: Wysokie zaangażowanie kierunkowe
Co czyni ruch słabym?
- Niska efektywność: Wymagał dużo wolumenu, aby przesunąć się niewiele
- Wysoki % strat: Duże knoty, małe korpusy (chaos)
- Sprzeczne ciśnienie: Zamknięcie wzrostowe, ale dominowała presja sprzedaży
- Słabe przekonanie: Brak zaangażowania kierunkowego pomimo wolumenu
Co oznacza absorpcja?
Gdy cena ma trudności z ruchem pomimo wysokiego wolumenu, rynek "absorbuje" ten wolumen. Oznacza to:
- Wysoka absorpcja: Obecność oporu/wsparcia, trudności w przesunięciu ceny
- Niska absorpcja: Łatwy ruch, mały opór
Przykładowe interpretacje:
„Silny wzrost byków (dominacja kupujących)”
- Wysoki wolumen + wysoka efektywność + niski % strat + wzrost netto + dominacja presji kupna
„Niezdecydowanie przy wysokim wolumenie (potencjalne odwrócenie)”
- Wysoki wolumen + ekstremalny % strat + mały korpus + zrównoważone ciśnienie
„Zamknięcie wzrostowe pomimo presji spadkowej”
- Zamknięcie na plusie, ale presja sprzedaży przewyższyła presję kupna (dywergencja, potencjalna pułapka)
„Niska aktywność, brak zaangażowania”
- Niski wolumen + średnia efektywność + brak wyraźnej dominacji ciśnienia
__________________________________________________________________________________________
ZALETY I KORZYŚCI
1. Kwantyfikuje intuicję
- Jeśli kiedykolwiek myślałeś „to wygląda na chaotyczne” lub „ten ruch wydaje się słaby”, ten wskaźnik kwantyfikuje te obserwacje
- Dostarcza obiektywnych metryk dla subiektywnych ocen
2. Analiza wielowymiarowa
- Większość narzędzi pokazuje wolumen LUB wzory cenowe. Ten pokazuje ich zależność
- Łączy wolumen, strukturę cen, kierunkowe nastawienie i dynamikę ciśnienia w jednym widoku
3. Świadomość kontekstu
- Oceny pojedynczych słupków uwzględniają kontekst trendu
- Rozróżnia „konsolidację w trendzie wzrostowym” od „konsolidacji w trendzie spadkowym”
- Wskazuje ruchy przeciwnetrendowe, które mogą być pułapkami
4. Edukacyjny
- Interpretacje w języku naturalnym pomagają zrozumieć dynamikę rynku
- Z czasem zaczniesz rozpoznawać wzorce efektywności bez wskaźnika
5. Wszechstronne zastosowanie
- Traderzy trendowi: Identyfikują, kiedy trendy są silne, a kiedy wyczerpujące
- Traderzy zakresowi: Wykrywają strefy konsolidacji o wysokim % strat
- Traderzy wybicia: Wykrywają decydujące wybicia z wysokim wolumenem vs. fałszywe wybicia
- Traderzy wolumenowi: Widzą wolumen w kontekście osiągniętego efektu
6. Brak opóźnień
- Wszystkie obliczenia oparte na zakończonych słupkach (lub aktualnie formującym się)
- Brak wygładzania, średnich kroczących, brak przemalowywania
__________________________________________________________________________________________
WYZWANIA I OBIEWY
Przed użyciem tego wskaźnika zrozum ważne kwestie:
Ten wskaźnik NIE jest dla każdego:
1. Wysoka złożoność
- Ponad 20 metryk w 8 grupach kolumn
- Wymaga zrozumienia analizy wolumenu, ruchu cen i mikrostruktury rynku
- Krzywa uczenia się jest stroma — spodziewaj się 1-2 tygodni obserwacji zanim wzorce staną się jasne
2. Przeciążenie informacjami
- Domyślny widok „pokaż wszystko” jest przytłaczający
- Musisz dostosować go do swojego stylu handlu
- Możliwa jest paraliż decyzyjny, jeśli spróbujesz używać wszystkich metryk naraz
3. Nie jest systemem handlowym
- Ten wskaźnik NIE mówi, kiedy kupować lub sprzedawać
- Informuje, co robi rynek, a nie co TY powinieneś zrobić
- Musisz zintegrować go z własnymi zasadami wejścia/wyjścia
4. Wymagana interpretacja
- „Niezdecydowanie przy wysokim wolumenie” może oznaczać przedwybicie LUB wyczerpanie
- „Efektywny ruch wzrostowy” nie gwarantuje kontynuacji
- Potrzebujesz kontekstu rynkowego poza tym, co pokazuje wskaźnik
5. Ograniczenia wolumenu
- Forex używa wolumenu tickowego (liczba transakcji), a nie rzeczywistego wolumenu
- Instrumenty o niskiej płynności mogą pokazywać niestabilne odczyty efektywności
- Wydarzenia informacyjne mogą tymczasowo zniekształcać metryki przez skoki wolumenu
6. Wydajność na niższych interwałach
- Na wykresach 1-minutowych z ponad 100 widocznymi słupkami interfejs może działać wolno
- Więcej słupków = więcej obliczeń na aktualizację
- Zalecane: używaj wykresów ≥5-minutowych do monitoringu w czasie rzeczywistym
7. Brak alertów
- Obecnie nie generuje alertów dla konkretnych warunków
- Musisz ręcznie monitorować wyświetlane dane
8. Subiektywne progi
- „Wysoki” wolumen definiowany jest jako 1,25x średniej — to mój osobisty próg
- „Ekstremalny” % strat to ≥80% — również subiektywne
- Możesz nie zgadzać się z tymi definicjami, ale są one zakodowane na stałe
__________________________________________________________________________________________
JAK TO DZIAŁA
1. Zbieranie danych
- Określ okres analizy (zakres daty/czasu)
- Dla każdego słupka w okresie zbierz dane OHLCV z wykresu
- Oblicz metryki pochodne i efektywności dla każdego słupka
- Agreguj metryki, aby ustalić średnie i ekstremalne wartości
2. Logika interpretacji
Oceny w języku naturalnym opierają się na macierzy decyzyjnej z priorytetami:
Priorytet 1: Wzorce niezdecydowania
- Ekstremalny % strat (≥80%) lub mały korpus z dużymi knotami → sygnały Doji/Odrzucenia
- Wysoki wolumen + ekstremalne straty → Potencjalne wyczerpanie
Priorytet 2: Scenariusze wysokiego wolumenu
- Wysoki wolumen + wysoka efektywność + niskie straty → Decydujący impuls
- Wysoki wolumen + wysoka efektywność + wysokie straty → Wybicie z oporem
- Wysoki wolumen + niska efektywność + wysokie straty → Absorpcja/kwestionowany ruch
Priorytet 3: Sygnały oparte na efektywności
- Wysoka efektywność niezależnie od wolumenu → Czyste/efektywne ruchy
- Niska efektywność → Dryf, szlifowanie lub słabe ruchy
Priorytet 4: Zapasowe poziomy wolumenu
- Niski wolumen → Dryf, brak zaangażowania
- Średni wolumen → Oceniany przez przekonanie, % korpusu, poziom strat
3. Udoskonalenia:
- Analiza ciśnienia wykrywa sprzeczności (np. „zamknięcie wzrostowe, ale dominowała presja sprzedaży”)
- Analiza knotów identyfikuje odrzucenie (górne knoty na słupkach wzrostowych = sprzedający bronili szczytów)
- Kontekst trendu dodaje znaczniki „[z trendem]” lub „[przeciwnetrendowy]”
4. Podsumowanie obliczeń
- Zlicz słupki wzrostowe vs. spadkowe
- Oblicz efektywność kierunkową (ruchy byków vs. niedźwiedzi)
- Zmierz wskaźniki absorpcji (jak duży opór napotkała każda strona)
- Oblicz skumulowany ruch netto i kontekst trendu
- Wygeneruj zunifikowany bias łączący liczbę, wielkość i kierunek trendu
__________________________________________________________________________________________
NOTATKI TECHNICZNE
Metoda obliczeń
- Używa skumulowanej analizy słupków w każdym okresie
- Sumuje wolumen, knoty, korpusy wszystkich podsłupków
- Oblicza kierunkowy bias netto na podstawie danych skumulowanych
- Dokładniejszy niż prosta analiza OHLC
Normalizacja
- Efektywność normalizowana względem min/max w widocznym zbiorze danych
- Zapewnia kontekstową adekwatność ocen
- Skala ocen: Ekstremalna (80-100%) → Wysoka (60-80%) → Średnia (40-60%) → Niska (20-40%) → Najniższa (0-20%)
Kontekst trendu
- Oblicza skumulowane netto pipsy we wszystkich poprzednich okresach
- Identyfikuje kolejne okresy kierunkowe
- Porównuje ostatnią i wcześniejszą efektywność oraz ciśnienie
- Etykiety: „Trend wzrostowy (silny)”, „Trend spadkowy (słaby)”, „Konsolidacja”
__________________________________________________________________________________________
OSTATNIA UWAGA
Ten wskaźnik powstał z przekonania, że zrozumienie jakości rynku jest cenniejsze niż przewidywanie kierunku.
Zamiast pytać „czy cena pójdzie w górę?”, pyta:
- „Czy ten ruch jest wysokiej jakości?”
- „Czy kupujący/sprzedający mają trudności czy działają efektywnie?”
- „Czy to wybicie jest trwałe czy słabe?”
- „Czy obecna dynamika jest zgodna czy rozbieżna?”
Skupiając się na jakości zamiast przewidywania, traderzy mogą:
- Unikać ustawień o niskim prawdopodobieństwie
- Wchodzić w ruchy z zaangażowaniem
- Wychodzić, gdy wysiłek przewyższa wynik
- Rozumieć, kiedy lepiej się wycofać (słabe środowisko)
Jeśli cenisz przejrzystość, edukację i zrozumienie dlaczego cena porusza się tak, a nie inaczej, ten wskaźnik może być dla Ciebie wartościowy.
Jeśli wolisz prostotę i szybkie sygnały, inne narzędzia będą dla Ciebie lepsze.
__________________________________________________________________________________________
WIĘCEJ DARMOWYCH WSKAŹNIKÓW
Odkryj szeroki wachlarz narzędzi analizy rynku — od struktury i wolumenu po regresję, zmienność i niestandardowe interwały czasowe.
Kod źródłowy jest dostępny w repozytorium GitHub repository.
Wszystko darmowe do użytku. Ale jeśli chcesz wesprzeć kawą, możesz to zrobić tutaj.
Wsparcie/Oporność
Wolumen
- Volume Activity Profiler
- Volume Efficiency Analyzer
- Volume Profile Analytics
- Volume Profile - Updated
- Volume Spread Analysis
- VWAP (Volume Weighted Average Price)
Średnie kroczące
- SSL Channel
- Anchored Moving Average
- Deviation-Scaled Moving Average
- Gann High Low Activator
- Instantaneous Trendline
- Kaufman Adaptive MA with Trend Vision
- Moving Average Channel
- Moving Averages Suite
- Trend Channel Moving Average
Narzędzia/niestandardowe
Oparte na regresji
Zmienność
Oscylatory
__________________________________________________________________________________________
ZASTRZEŻENIE
Handel wiąże się z ryzykiem. Ten wskaźnik jest przeznaczony wyłącznie do analizy technicznej — zawsze stosuj odpowiednie zarządzanie ryzykiem i handluj odpowiedzialnie.
OPINIE I ULEPSZENIA
Jeśli masz sugestie, prośby o funkcje lub pomysły na ulepszenia, zostaw komentarz na karcie Dyskusja. Twoja opinia pomaga ulepszać wskaźnik dla wszystkich.
Podsumowanie
Key features include customizable column groups, color highlighting, and time zone adjustments for various trading sessions. The indicator quantifies market conditions by identifying efficient versus inefficient moves, absorption levels, and directional pressure, helping traders distinguish between decisive, exhausted, or indecisive price actions after they occur. It incorporates trend context and natural language interpretations to aid understanding of market dynamics.
Volume Efficiency Analyzer does not generate buy/sell signals or alerts; it is intended to complement traders’ own strategies by providing objective metrics that quantify market quality rather than predict direction. It requires familiarity with volume analysis and market microstructure due to its complexity and information density. The indicator is suitable for trend, range, breakout, and volume-focused traders seeking a comprehensive, multi-dimensional view of market behavior.
Opinie klientów
5 | 100 % | |
4 | 0 % | |
3 | 0 % | |
2 | 0 % | |
1 | 0 % |
Dyskusja
Częste pytania
Więcej od tego autora









![Logo „[Hamster-Coder] Moving Average MTF”](https://cdn.ctrader.com/image/webp/b11b98b1-194d-4b8e-b00e-d611826ad159_31226)











Cena