
Beschreibung
📈 Signal Moving Average 📉
Der Signal Moving Average ist ein Indikator, der einen einfachen gleitenden Durchschnitt (SMA) mit einer dynamischen Korrelationsberechnung kombiniert, um sich besser an Marktbedingungen anzupassen. 🎯 Dieser Indikator passt seine Empfindlichkeit basierend auf der Stärke des Trends an und ist somit ein leistungsstarkes Werkzeug zur Identifizierung von Trends und zur Filterung von Marktrauschen. 🌟
Hauptmerkmale 🔑
📊 Angepasster gleitender Durchschnitt:
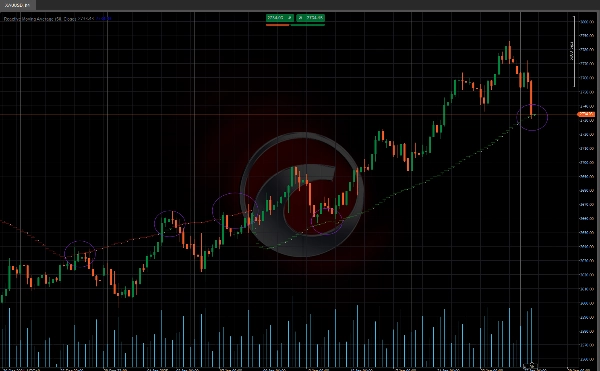
- Die Linie des gleitenden Durchschnitts passt sich dynamisch basierend auf der Korrelation zwischen Preis und Zeit an.
- In stark trendenden Märkten bewegt sich der gleitende Durchschnitt schneller, um dem Preis zu folgen. 🚀
- In seitwärts gerichteten Märkten bleibt der gleitende Durchschnitt stabiler, um Fehlsignale zu reduzieren. 🛑
🔢 Korrelationsberechnung:
- Der Indikator berechnet die Korrelation zwischen Preis und Zeit mithilfe der Pearson-Formel.
- Er passt den gleitenden Durchschnitt basierend auf dem Bestimmtheitsmaß (R²) an. 🧮
👀 Visualisierung:
- Klare und intuitive Darstellung für eine einfache Interpretation. 📉📈
Anwendung des Indikators 🛠️
🔍 Trenderkennung:
- Aufwärtstrend: Wenn der Preis über dem korrelierten gleitenden Durchschnitt liegt. 🐂
- Abwärtstrend: Wenn der Preis unter dem korrelierten gleitenden Durchschnitt liegt. 🐻
✅ Signalbestätigung:
- Verwenden Sie den angepassten gleitenden Durchschnitt als dynamische Unterstützungs- oder Widerstandsebene. 🛡️
- Kombinieren Sie diesen Indikator mit anderen technischen Werkzeugen, um Signale zu bestätigen. 🔄
Anpassung des gleitenden Durchschnitts ⚙️
Der Algorithmus passt den gleitenden Durchschnitt basierend auf dem Wert von R² an:
- Wenn R² > 0,5 (signifikante Korrelation):
-
- Der gleitende Durchschnitt wird mittels einer gewichteten Kombination zwischen dem aktuellen SMA-Wert und dem vorherigen Wert des angepassten gleitenden Durchschnitts (_ma) angepasst.
- Die Gewichtung hängt vom Wert des R² ab. ⚖️
- Wenn R² ≤ 0,5 (nicht signifikante Korrelation):
-
- Der gleitende Durchschnitt wird angepasst, indem ein Wert subtrahiert wird, der proportional zur absoluten Differenz zwischen dem aktuellen SMA-Wert und dem vorherigen Wert des angepassten gleitenden Durchschnitts ist. 🔄
- Ctrader Store Indikatoren:
Dynamic Market Structure
Analyse von Wendepunkten
Fibonacci Linear
Regression Multi-Timeframe
Multi-Level Candle Bias
Tracker
Auto Support and
Resistance Trend Lines
Zusammenfassung
Key functionalities include:
- **Adjusted Moving Average**: The moving average line dynamically adapts according to the correlation between price and time. It accelerates in strong trending markets to closely follow price movements and stabilizes in sideways markets to minimize false signals.
- **Correlation Calculation**: Utilizes the Pearson formula to compute the correlation between price and time, adjusting the moving average based on the coefficient of determination (R²).
- **Moving Average Adjustment**: When R² is greater than 0.5, the moving average is updated using a weighted combination of the current SMA and the previous adjusted value, with weights depending on R². For R² less than or equal to 0.5, adjustments are made by subtracting a value proportional to the difference between the current SMA and prior adjusted average.
- **Visualization**: Provides a clear and intuitive display for easy interpretation.
Usage involves identifying bullish trends when price is above the adjusted moving average and bearish trends when below. The indicator can also serve as a dynamic support or resistance level and be combined with other technical tools for signal confirmation.
Kundenbewertungen
5 | 100 % | |
4 | 0 % | |
3 | 0 % | |
2 | 0 % | |
1 | 0 % |


![„[Hamster-Coder] Moving Average MTF“-Logo](https://cdn.ctrader.com/image/webp/b11b98b1-194d-4b8e-b00e-d611826ad159_31226)


