
Opis
Adaptacyjny System Trailingowy 🚀
Adaptacyjny System Trailingowy to zaawansowany adaptacyjny trailing stop, który wykorzystuje logarytmicznie znormalizowaną zmienność do automatycznego dostosowywania poziomów ochrony zysku. 📊 W przeciwieństwie do tradycyjnych trailing stopów o stałych odległościach, system ten oblicza dynamiczne odległości na podstawie rzeczywistej zmienności rynku, nieustannie dostosowując się do zmieniających się warunków. 🔄
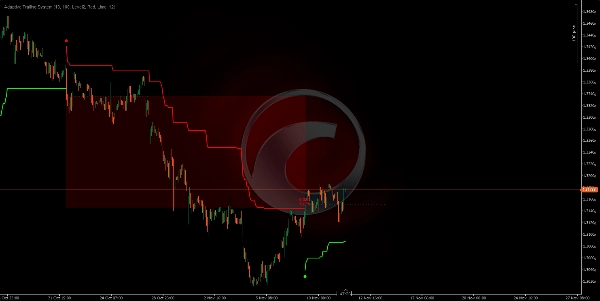
Spotware GBPUSD 691360763c684 | cTrader
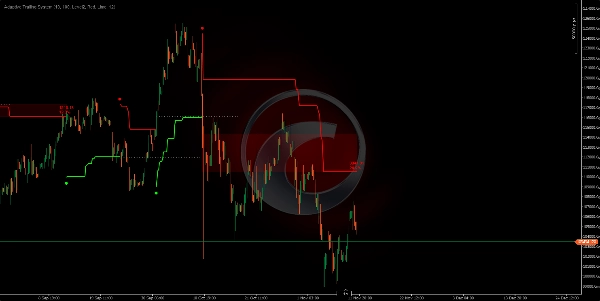
Spotware XAUUSD 691360adf1386 | cTrader
Spotware XAUUSD 691360adf1386 | cTrader
Unikalny Adaptacyjny Algorytm Trailingowy ⚙️
System wykorzystuje metodę statystyczną która nigdy nie generuje tych samych odległości trailingu:
• Oblicza True Range ceny w konfigurowalnym okresie.
• Stosuje transformację logarytmiczną do tych wartości w celu normalizacji rozkładu.
• Oblicza średnią i odchylenie standardowe tych logarytmicznych wartości.
• Generuje unikalną odległość offsetu opartą na poziomach zmienności (0, 1, 2 lub 3 odchylenia standardowe). 🎯
• Trailing stop jest ciągle dostosowywany za pomocą typowej ceny (średnia z High, Low, Close).
Wynik: Każdy moment na rynku ma swoją własną odległość trailingu, obliczaną zgodnie z konkretną zmiennością tego kontekstu. 🤖
Podstawa Techniczna: Logarytmicznie Znormalizowana Zmienność 🧠
Dlaczego transformacja logarytmiczna? 🤔
Zmienność rynku nie podąża za rozkładem normalnym (Gaussa); ma tendencję do wartości ekstremalnych. Transformacja logarytmiczna:
- Normalizuje rozkład: Przekształca skośne dane w bardziej symetryczny rozkład.
- Stabilizuje wariancję: Zmniejsza wpływ nagłych skoków zmienności.
- Umożliwia porównania statystyczne: Pozwala na sensowne wykorzystanie odchylenia standardowego.
Proces Obliczania Offsetu 🔢
- True Range okresu: Mierzy maksymalny zakres, uwzględniając High-Low okresu oraz luki względem poprzedniego zamknięcia.
- Logarytm naturalny: Stosuje
ln(True Range)do normalizacji. - Okno normalizacji: Przechowuje ostatnie N logarytmicznych wartości (okres normalizacji).
- Średnia logarytmiczna: Średnia wszystkich wartości
ln(TR)w oknie. - Odchylenie standardowe: Oblicza rozproszenie logarytmicznych wartości.
- Poziom zmienności: Mnoży odchylenie przez 0, 1, 2 lub 3 w zależności od konfiguracji.
- Końcowy offset:
Offset = e^(mean + level × deviation)- konwersja z powrotem do skali cenowej. 💡
Jak to działa? ⚡
Dwukierunkowa mechanika trailingu
System działa w dwóch naprzemiennych trybach:
Tryb SPADKOWY (Short): 📉
• Trailing stop jest umieszczany POWYŻEJ ceny.
• Aktualizuje się w dół kiedy cena spada (nigdy nie rośnie).
• Sygnał odwrócenia kiedy cena ZAMYKA SIĘ powyżej trailing stopu.
Tryb WZROSTOWY (Long): 📈
• Trailing stop jest umieszczany PONIŻEJ ceny.
• Aktualizuje się w górę kiedy cena rośnie (nigdy nie spada).
• Sygnał odwrócenia kiedy cena ZAMYKA SIĘ poniżej trailing stopu.
Sygnały odwrócenia:
• Okrągła kropka oznacza zmianę trendu (wejście w nową pozycję).
• Zielony kolor = Nowy trend wzrostowy (). ✅
• Czerwony kolor = Nowy trend spadkowy (). 🔴
Parametry i wpływ 🎛️
Okres obliczeniowy (10)
- Funkcja: Określa, ile świec jest używanych do obliczenia True Range.
- ↑ Wyższy (20-50): Mierzy długoterminową zmienność, bardziej wygładzony, mniej czuły.
- ↓ Niższy (5-8): Mierzy krótkoterminową zmienność, bardziej reaktywny, wykrywa szybkie zmiany.
Okres normalizacji (100)
- Funkcja: Okno logarytmicznych wartości do obliczenia średniej i odchylenia standardowego.
- ↑ Wyższy (200-500): Bardziej stabilna normalizacja, stopniowe zmiany offsetu.
- ↓ Niższy (50-80): Bardziej reaktywna normalizacja, offset szybciej się dostosowuje.
- Krytyczny wpływ: Ten parametr określa, jak bardzo "zapamiętany" jest historyczny kontekst zmienności. 🧠
Poziom zmienności (Poziom 2)
- Funkcja: Liczba odchyleń standardowych stosowanych do obliczenia offsetu.
- Poziom 0 (0σ): Offset = średnia logarytmiczna = najciaśniejsza odległość, maksymalna czułość. 🎯
- Poziom 1 (1σ): Offset obejmuje 1 odchylenie = umiarkowana odległość, obejmuje ~68% zmienności.
- Poziom 2 (2σ): Offset obejmuje 2 odchylenia = szersza odległość, obejmuje ~95% zmienności (zrównoważony). ⚖️
- Poziom 3 (3σ): Offset obejmuje 3 odchylenia = bardzo szeroka odległość, obejmuje ~99% zmienności, maksymalna tolerancja. 🛡️
___________________________________________________________________________________________________
🚀 Ponad 10 000 traderów już korzysta z naszych NAJLEPSZYCH wskaźników🏆
👉 Pobierz wszystkie nasze NAJLEPSZE systemy tutaj:
_______________________________________________
📌 Wskaźniki Struktury Rynku
· ✅ AdvancedMarket Structure: Bos, Choch, SwinLevels, Order Blocks, Market Structure& Liquidity Finder
· 🔄 Dynamic Market StructureAnalysis of Turning Points
· 🧱 Order Block
· ⚖️ Market Imbalance
· ⛓️ BOS & CHOCH
· 🧠 ICT Power of 3
_______________________________________________
🔚 Systemy Inteligentnego Wyjścia
_______________________________________________
📐 Wskaźniki ZigZag
· 🔍 ZigZag Price LiquidityProjection
· ➖ ZigZag
_______________________________________________
🧱 Wskaźniki Wsparcia i Oporu
· 🟩 SmartTrend Support &Resistance Lines
· 🧱 All Support and ResistanceLevels
_______________________________________________
📊 Wskaźniki Trendu i Kanału
· 📊 Supertrend
_______________________________________________
💧 Narzędzia Wolumenu i Płynności
_______________________________________________
⚡ Wskaźniki Momentum i RSI
· 🔎 Multi-Level Candle Bias
Tracker
_______________________________________________
🔮 Narzędzia Predykcji i Projekcji
· 📐 Prediction Based on Linreg& ATR
· 📏 Fibonacci Linear RegressionMulti-timeframe
· 📈 Volume-Powered Market Flow Projector_________________________________________________________________________________________________
Podsumowanie
The system operates bidirectionally with two modes:
- Bearish (short) mode places the trailing stop above the price, adjusting downward as price falls, signaling a reversal when price closes above the stop.
- Bullish (long) mode places the trailing stop below the price, adjusting upward as price rises, signaling a reversal when price closes below the stop.
Reversal signals are visually marked with colored dots indicating trend changes (green for bullish, red for bearish). Key parameters include the calculation period for True Range, normalization period for volatility data, and volatility level defining the offset distance based on standard deviations.
This indicator supports various markets including Forex, cryptocurrencies, commodities, indices, and stocks, with symbols such as BTCUSD, EURUSD, GBPUSD, XAUUSD, NAS100, and USDJPY. It is designed to provide adaptive trailing stops that respond to real-time volatility, enhancing trade exit strategies.


