- Calculates the **Bollinger Bands** 📊 based on the Simple Moving Average (SMA) and the standard deviation of the closing price.
- Calculates the **Keltner Channels** 📈 using a moving average and either the true range or the range between highs and lows.
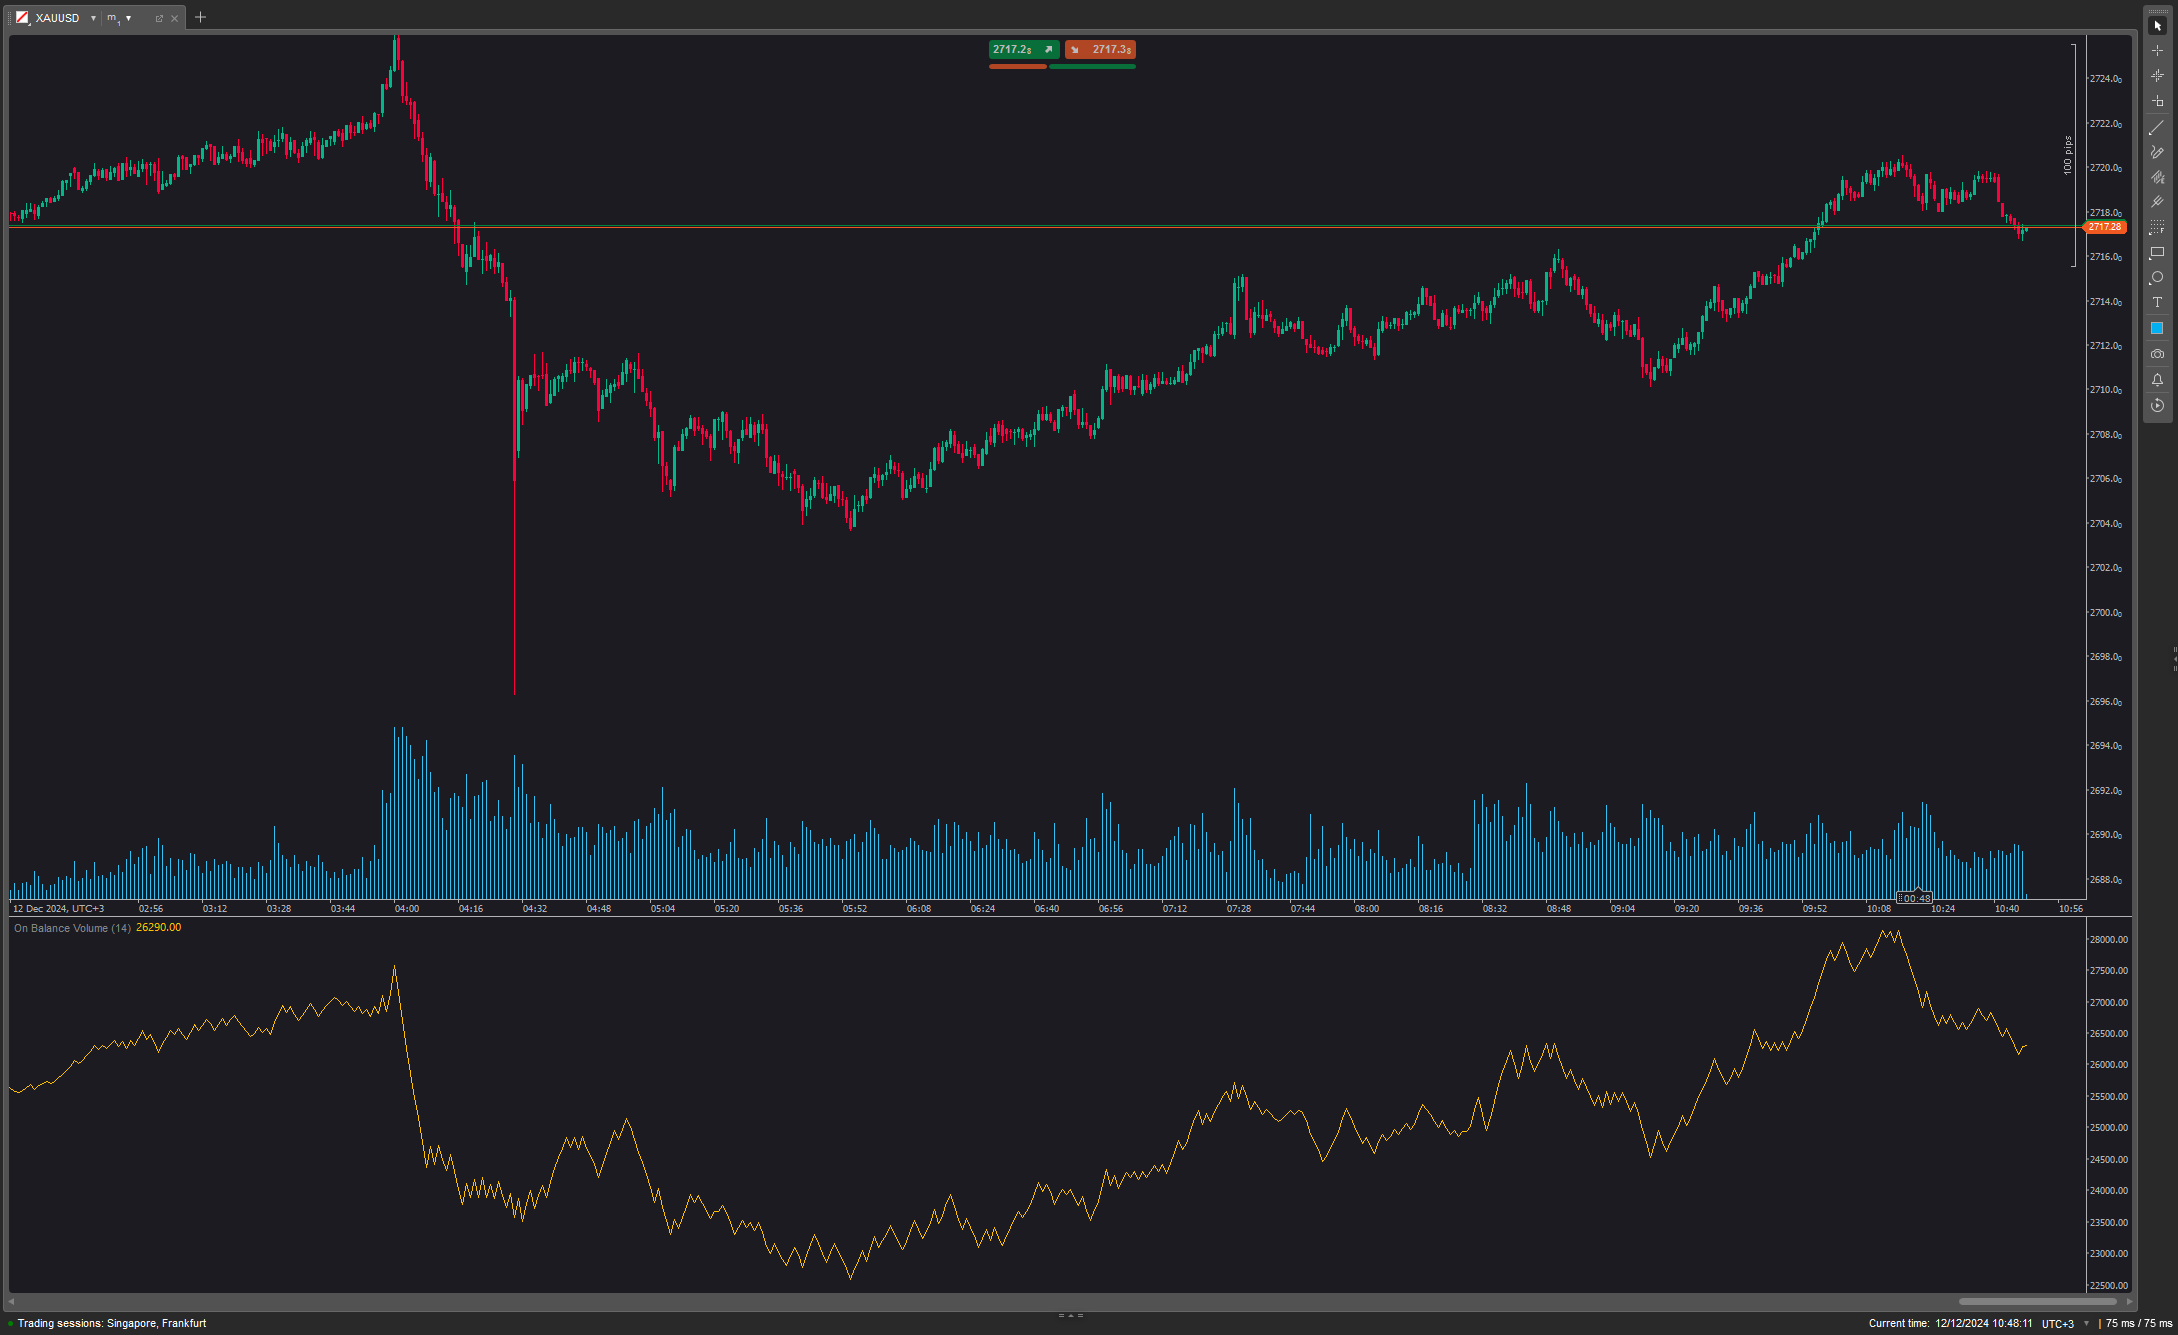
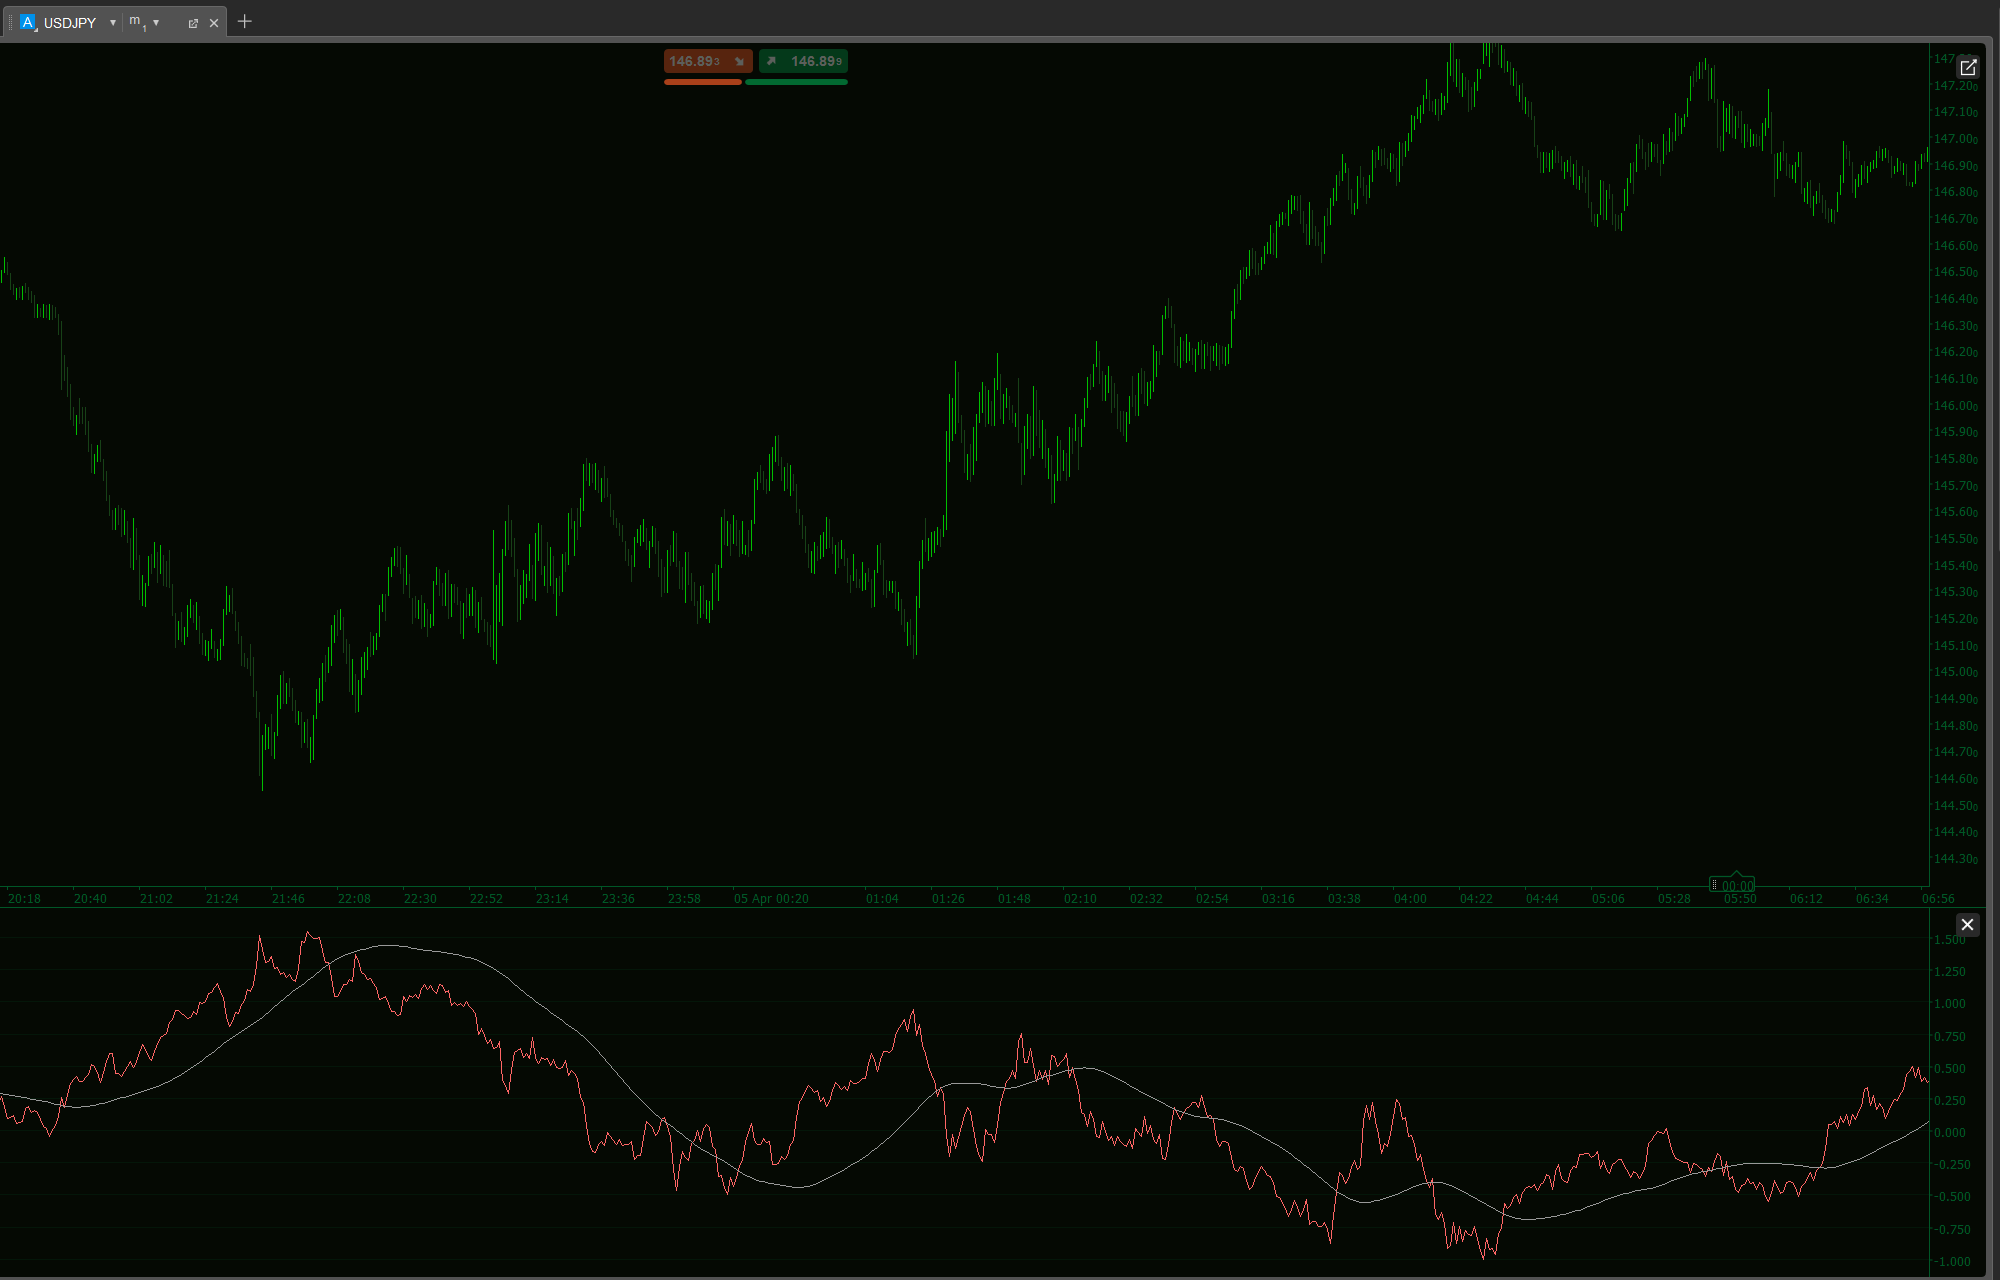
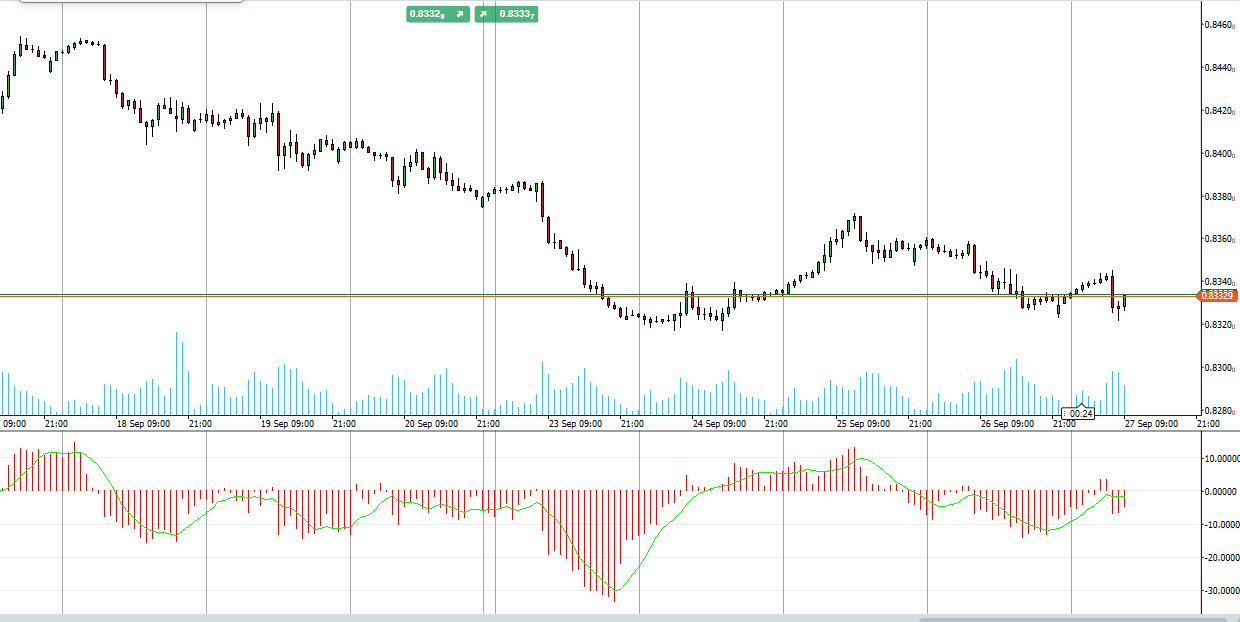
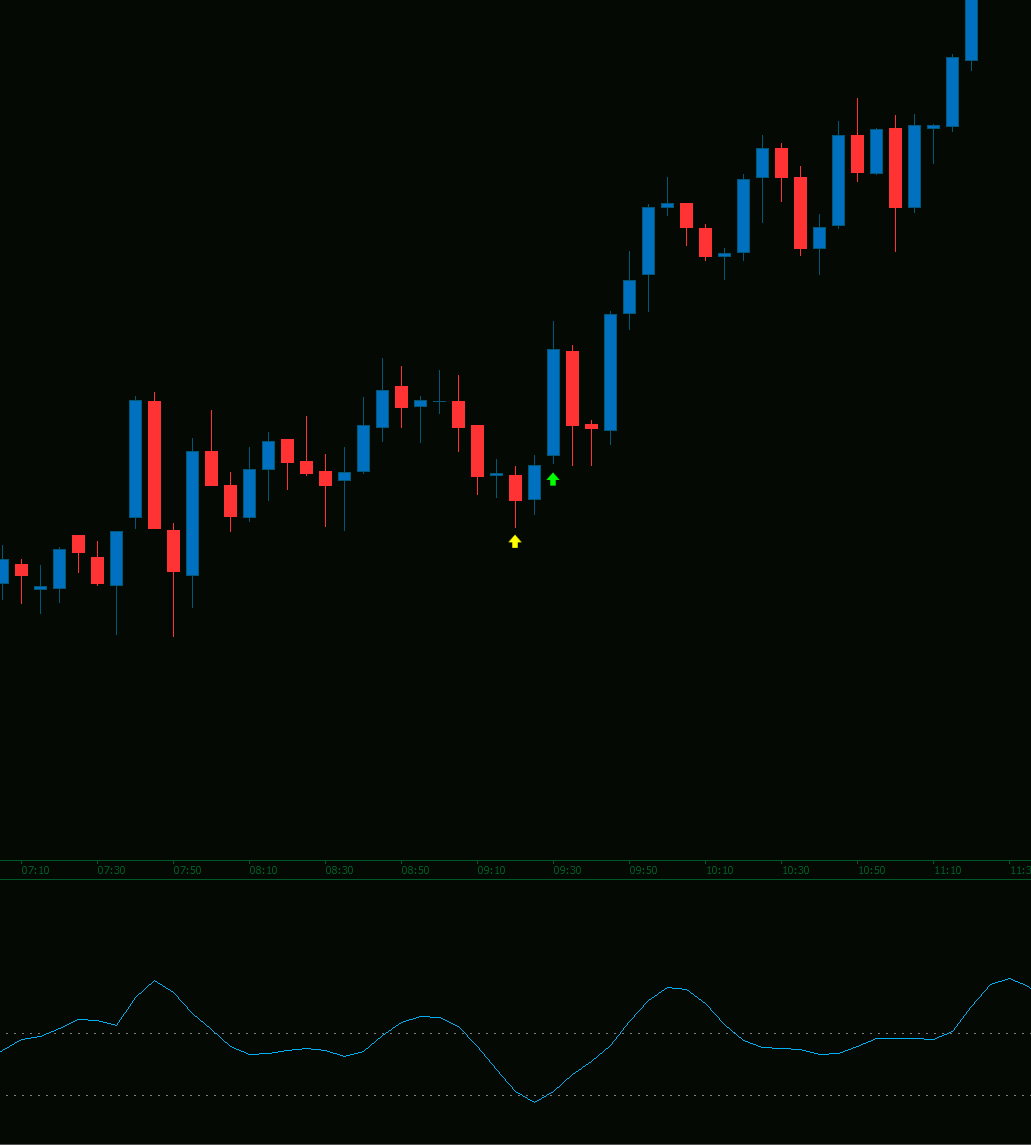
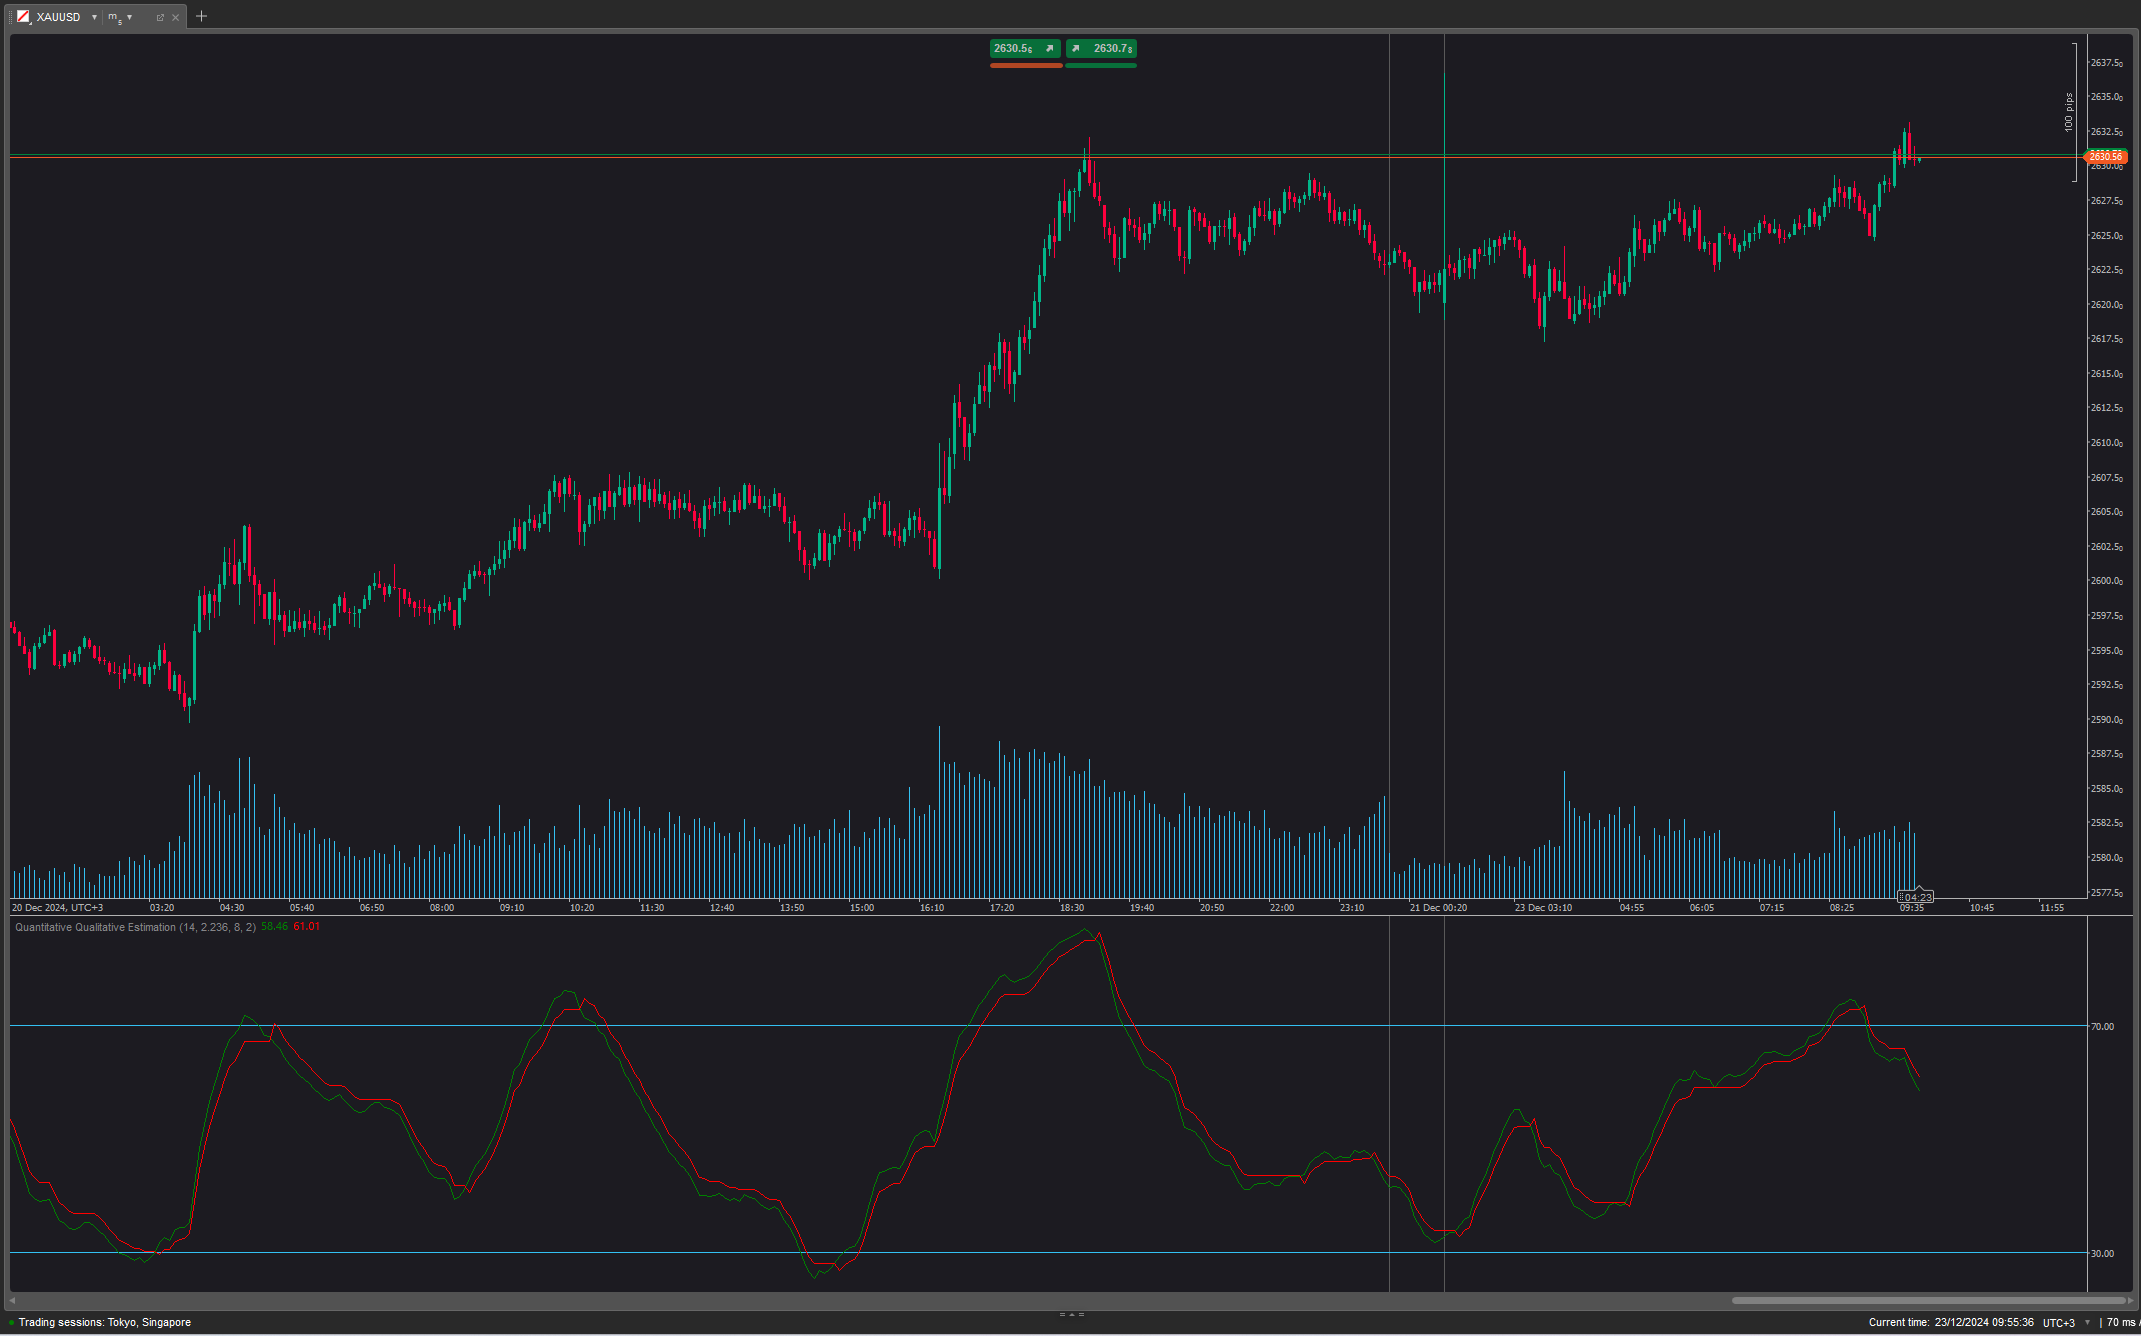
- Then, the indicator measures **momentum** ⚡ by calculating the difference between the current closing price and the average of recent highs and lows, displaying a **histogram**:
- **Green** for positive momentum 📈.
- **Red** for negative momentum 📉.
This histogram helps visualize the strength and direction of market movements, making it easier to spot potential trends or changes in market dynamics.
🔥 Pinescritlabs
Ctrader Store indicators: 🤖Pinescritlabs Ctrader Store cBots:
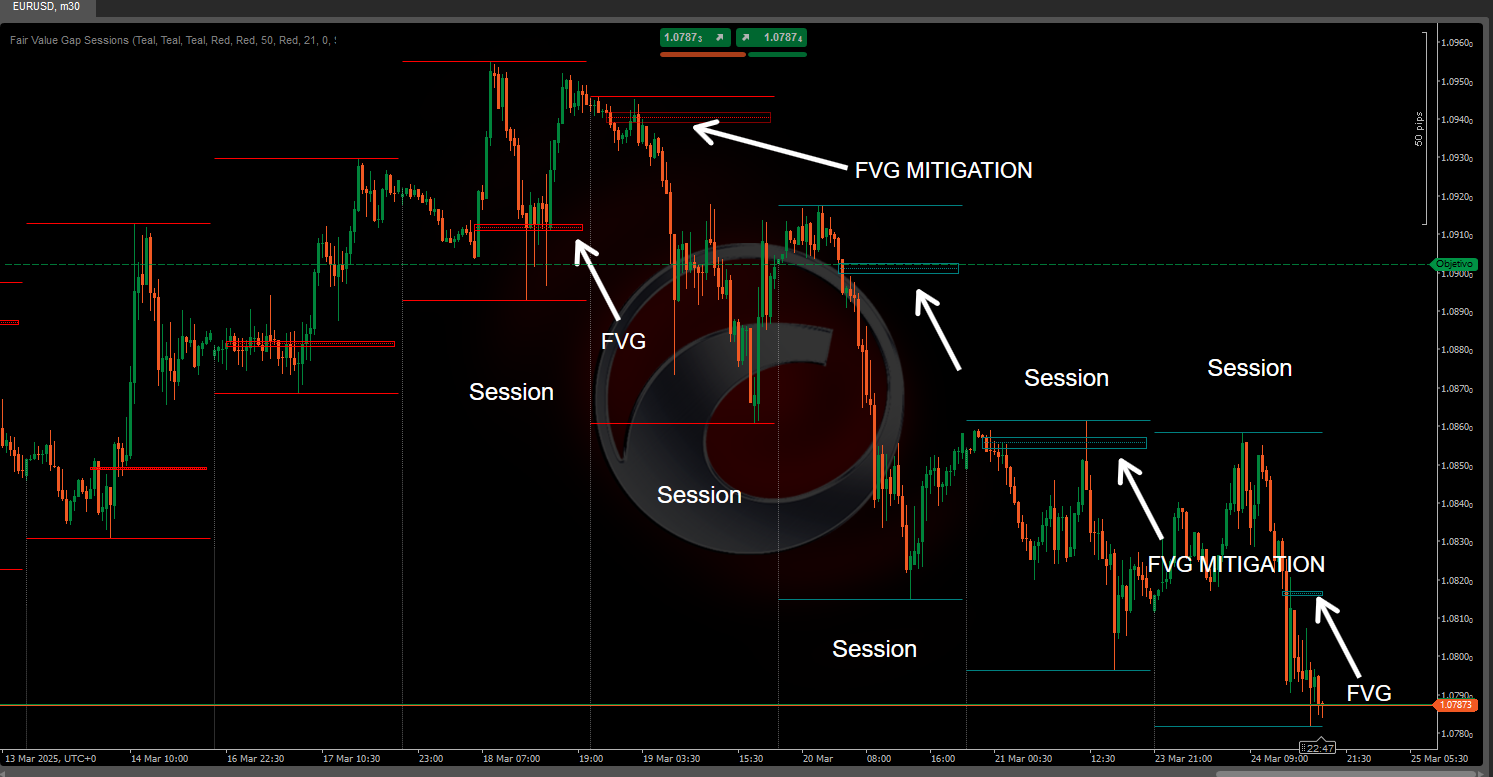
Fair Value Gap Sessions Gold & BTC Breakout Session Pivots(new)
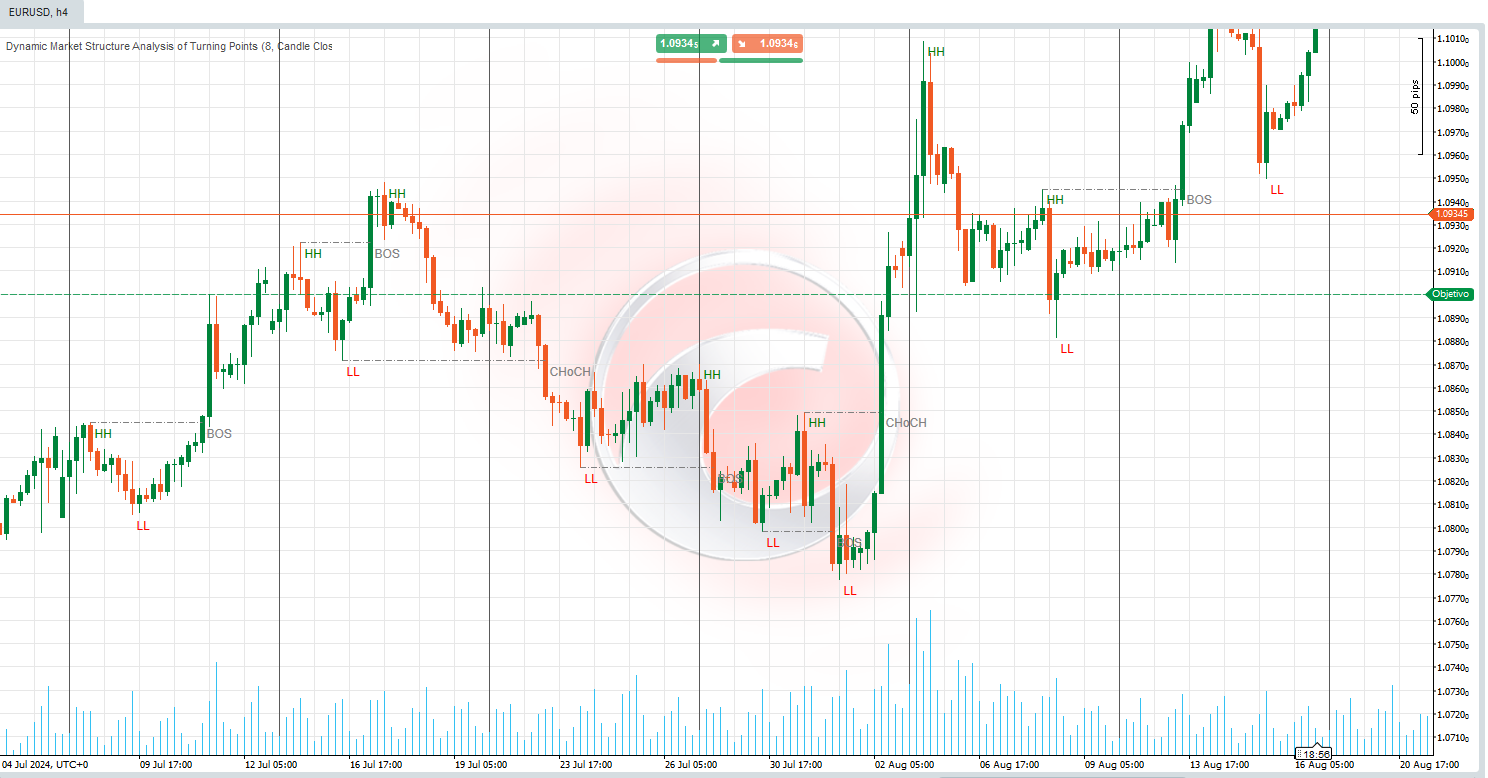
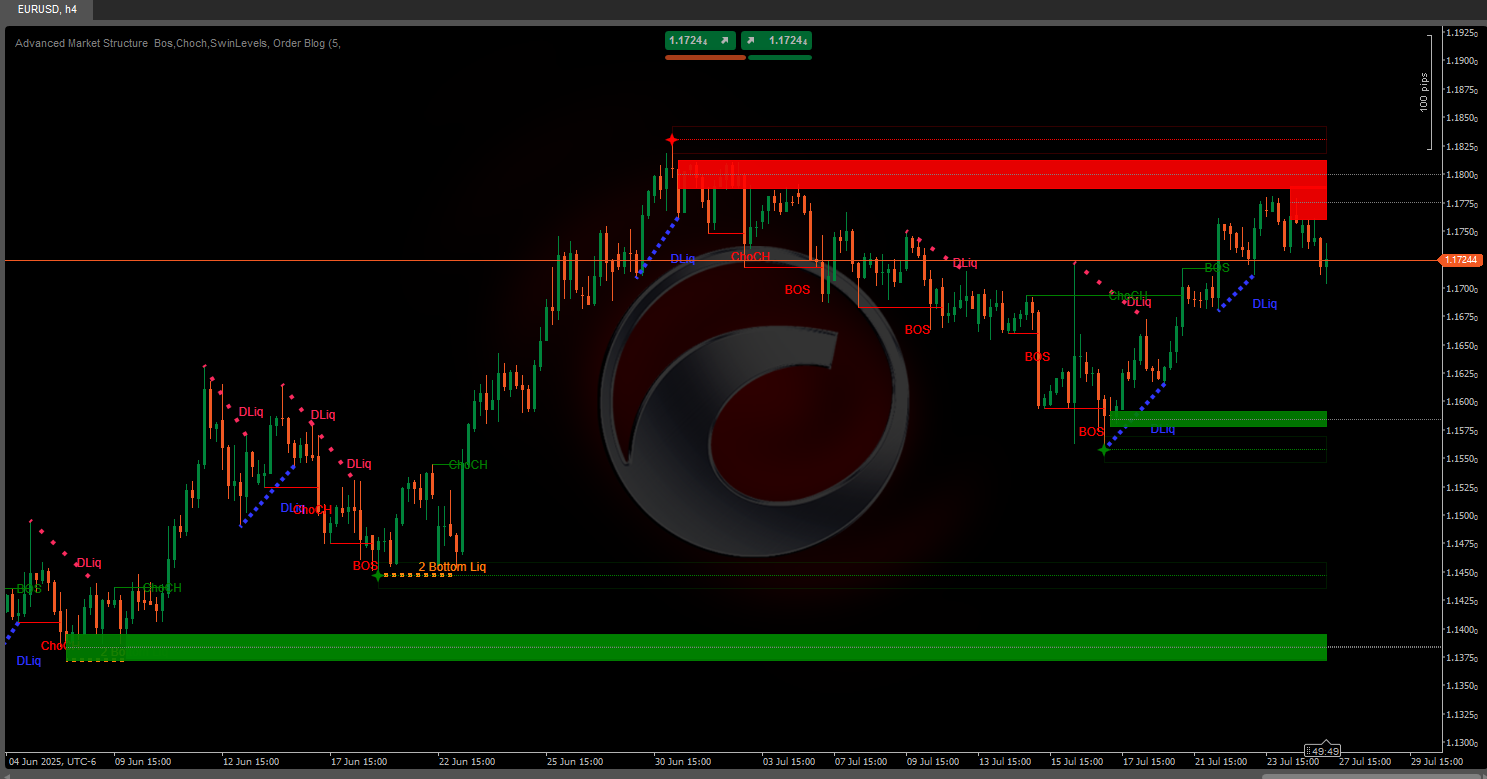
Dynamic Market Structure
Analysis of Turning Points
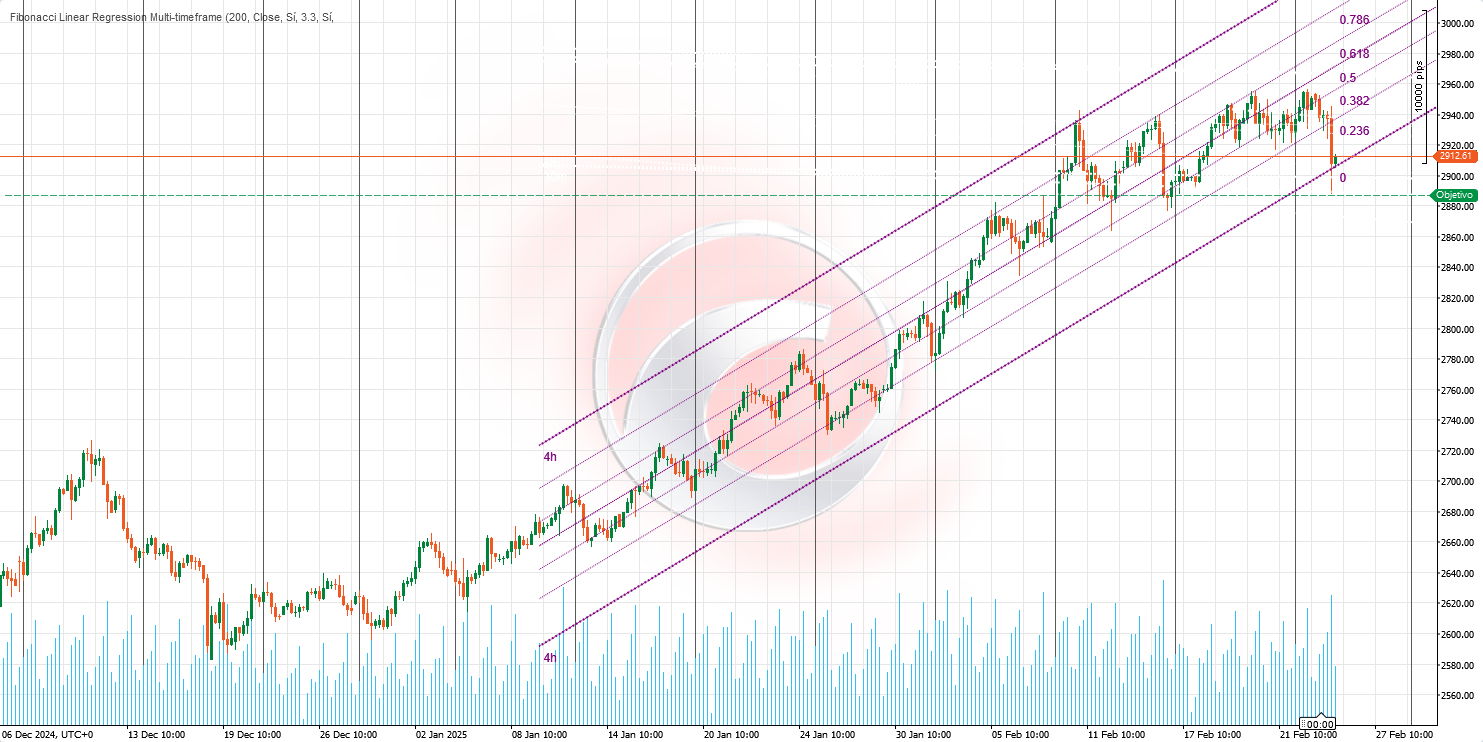
Fibonacci Linear
Regression Multi-timeframe
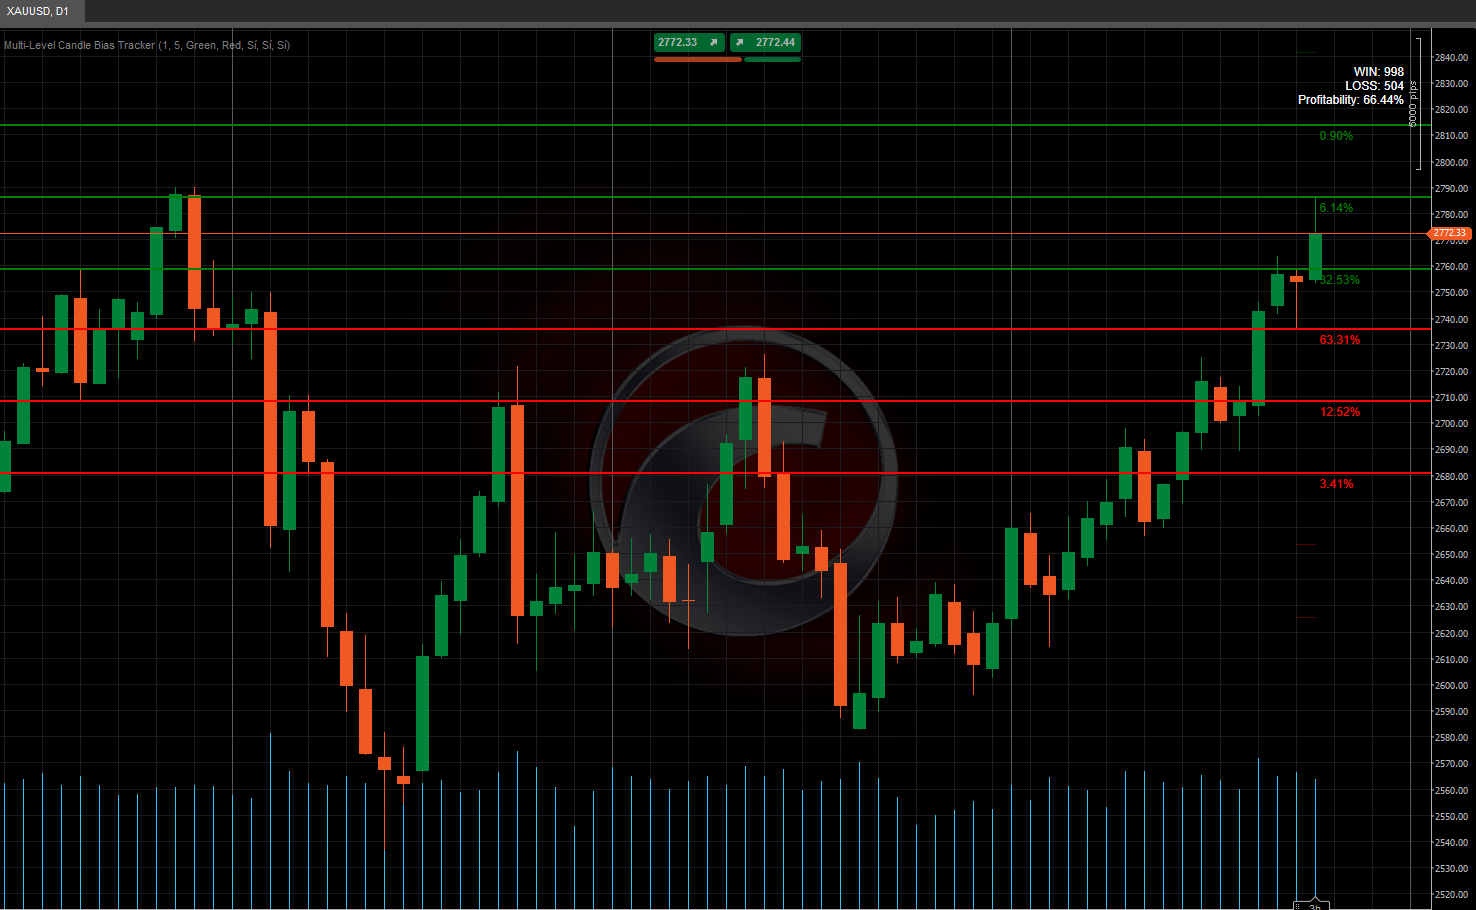
Multi-Level Candle Bias
Tracker
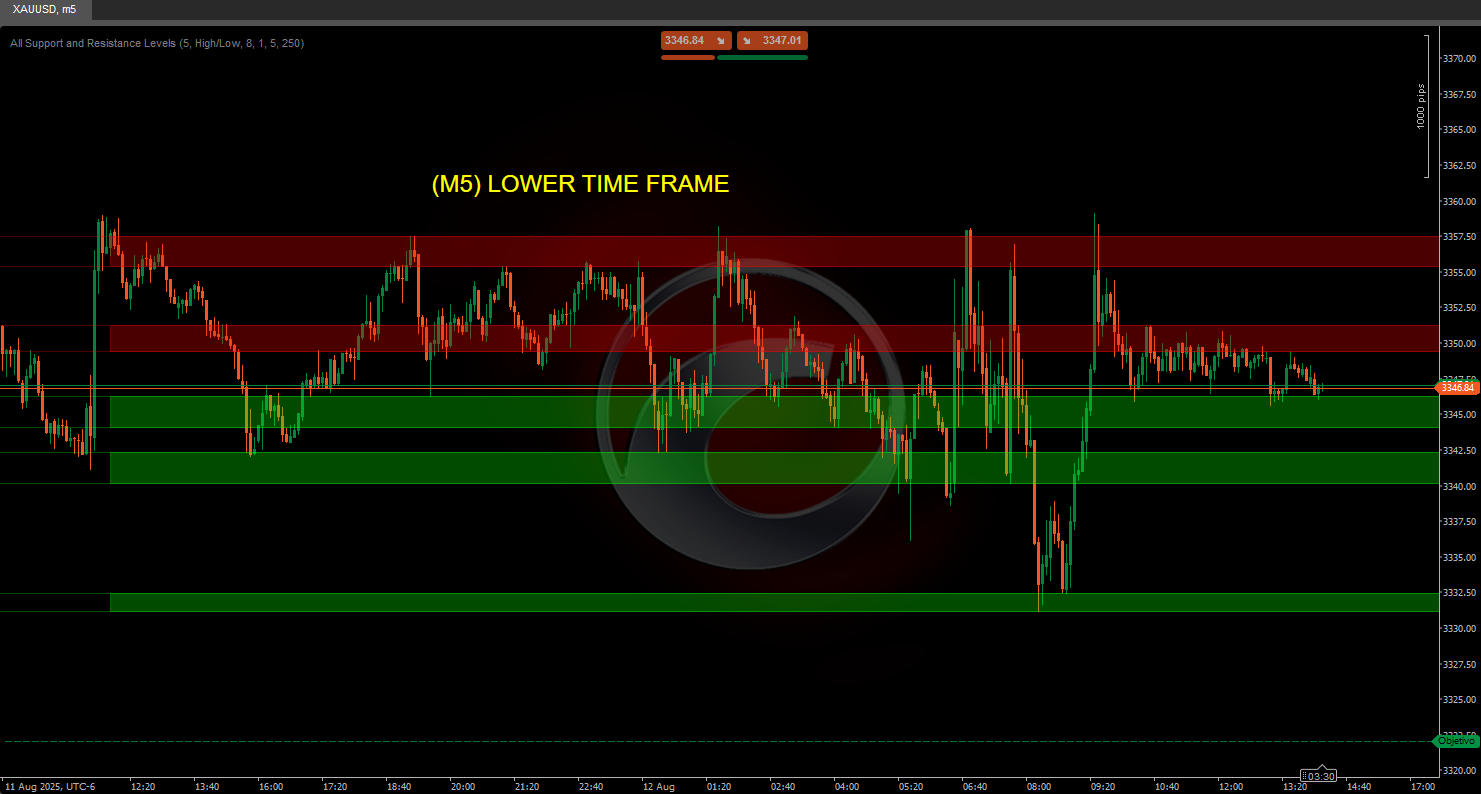
Auto Support and
Resistance Trend Lines


!["[Stellar Strategies] Moving Averages Combined 1.0" logo](https://market-prod-23f4d22-e289.s3.amazonaws.com/b4cd360c-5f3c-4902-b2e1-6b86da1199bb_Gemini_Generated_Image_nl1erpnl1erpnl1e.jpg)