
Descripción
El AdaptiveTrendChannel es un indicador que te ayuda a visualizar las tendencias del mercado de manera más clara y dinámica. 📈 A diferencia de una media móvil regular, se adapta en tiempo real a medida que evoluciona el precio, permitiéndote ver cuándo la tendencia está cambiando. 🔄
🛠️ ¿Cómo Funciona?
Lo primero que hace es generar una línea de referencia dinámica que se actualiza con cada vela. 🕯️ Piensa en esta línea como un punto de equilibrio, indicándote si el precio está en una zona de equilibrio o moviéndose en una dirección clara.
¡Pero esta línea no trabaja sola! También se basa en niveles internos que actúan como soportes y resistencias dinámicos. 💪 Estos niveles se ajustan constantemente según los máximos y mínimos recientes 📉📈, lo que significa que no son fijos—se adaptan a las condiciones del mercado en tiempo real.
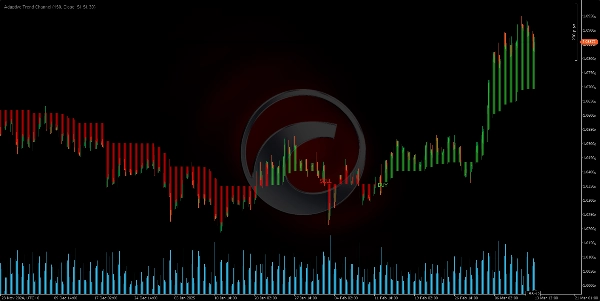
Cuando el precio se mueve por encima o por debajo de estos niveles dinámicos, el indicador detecta un cambio de tendencia y genera señales. Para hacerlo aún más claro, colorea el área entre la línea de referencia y el precio de cierre, haciendo que las tendencias sean visualmente evidentes. 🎨👀
📌 ¿Cómo Usarlo en el Trading?
Ahora, ¿cómo aplicas esto en operaciones reales? Fácil.
✅ Si el precio se mantiene por encima de la línea de referencia durante varias velas, el mercado se considera alcista. 🟢
❌ Si el precio cae por debajo de la línea de referencia, el mercado se considera bajista. 🔴
Dado que esta línea se ajusta dinámicamente y filtra el ruido del mercado, te ofrece una visión más clara de la tendencia.
Además, el indicador rastrea cruces recientes:
🔻 Si el precio cruza por debajo de un nivel interno clave, señala una fase bajista potencial.
🔺 Si el precio cruza por encima de un nivel interno clave, señala una fase alcista potencial.
Con esta información, el indicador hace dos cosas clave:
🎨 Cambia el color de la línea y del área del gráfico, dándote una señal visual instantánea sobre la dirección de la tendencia.
📢 Genera señales de compra/venta cuando se detecta un cambio de tendencia.
🔥 ¿Por Qué Es Tan Poderoso?
El AdaptiveTrendChannel te ayuda a mantenerte del lado correcto de la tendencia y evitar operar en contra del impulso del mercado. Destaca momentos clave para puntos de entrada y salida, ofreciéndote una referencia visual clara para decisiones de trading más inteligentes.
Cuando se combina con otras herramientas como análisis de volumen o acción del precio, se convierte en un aliado poderoso para filtrar operaciones y mejorar la precisión en la entrada. 🚀💰
Indicadores de la tienda Ctrader:
Dynamic Market Structure
Analysis of Turning Points
Fibonacci Linear
Regression Multi-timeframe
Multi-Level Candle Bias
Tracker
Auto Support and
Resistance Trend Lines
All Support and
Resistance Levels
Resumen
When the price moves above or below these adaptive levels, the indicator detects trend changes and produces buy or sell signals. It visually highlights trends by coloring the area between the reference line and the closing price, providing clear visual cues on trend direction. Traders can interpret price staying above the reference line as bullish and below it as bearish, with the indicator filtering out market noise for a cleaner trend view.
Additionally, the Adaptive Trend Channel tracks recent crossovers of key internal levels to signal potential bullish or bearish phases. It is intended to help traders stay aligned with market momentum and identify key entry and exit points. When combined with other tools like volume analysis or price action, it supports improved trade filtering and entry precision.
Valoraciones de clientes
5 | 100 % | |
4 | 0 % | |
3 | 0 % | |
2 | 0 % | |
1 | 0 % |


![Logotipo de "[Stellar Strategies] MARSI Signal Plotter"](https://cdn.ctrader.com/image/webp/7b2b8da6-8f8e-4646-8d4a-4710c516c01e_25567)


