
Description
Description
Indicateurs Pinescriptlabs Store : 🤖Pinescriptlabs Store cBots :
ICT Power of 3 (cBot) Gold & BTC BreakoutSession Pivots(nouveau)YieldShield"
SmartTrend Support &
Lignes de Résistance
Dynamic Market Structure
Analyse des points de retournement
Fibonacci Linear
Régression Multi-timeframe
Multi-Level Candle Bias
Tracker
Auto Support and
Resistance Trend Lines
All Support and
Resistance Levels
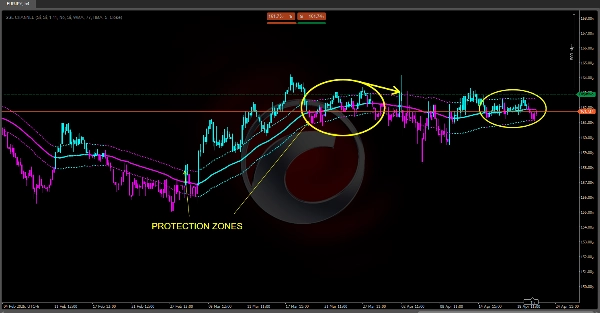
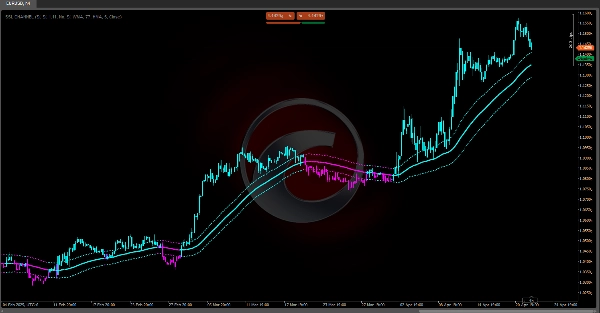
Le Canal SSL Premium 🔍
Combine la détection de tendance via une moyenne mobile, l’évaluation de la volatilité avec des bandes basées sur l’ATR, et un filtre à court terme (SSL) pour offrir un système d’analyse intégré. 💡 Sa force réside dans la clarté de ses signaux visuels et son adaptabilité aux marchés, tandis que son principal défi est de minimiser le retard et de filtrer les mouvements latéraux. Avec une bonne paramétrisation, il devient un outil puissant pour les décisions d’entrée/sortie en trading. 🎯
1. Objectif & Utilité en Trading 📊
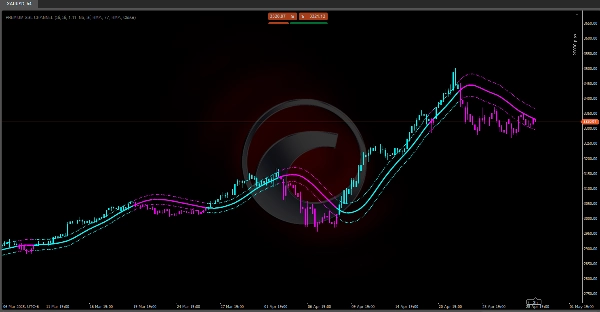
• Détection de la tendance principale : Grâce à une ligne centrale (la "Baseline"), l’indicateur montre la direction dominante du marché. 📈📉
• Mesure de la volatilité : En utilisant une plage moyenne (ATR), il ajuste deux bandes (au-dessus/en-dessous de la Baseline) comme zones dynamiques de support/résistance. ⚡
• Filtre de bruit & changement de biais : Le canal SSL (une moyenne mobile adaptative basée sur les hauts/bas) identifie les retournements à court terme pour des entrées/sorties précises. 🔄
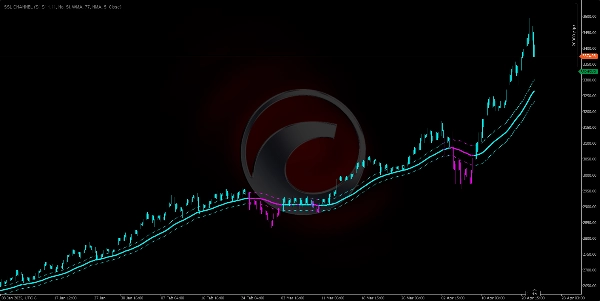
• Visualisation intuitive : Colore les barres de prix et les lignes selon le biais (cyan = haussier, magenta = baissier) pour une interprétation instantanée. 🎨
2. Composants principaux & Logique ⚙️
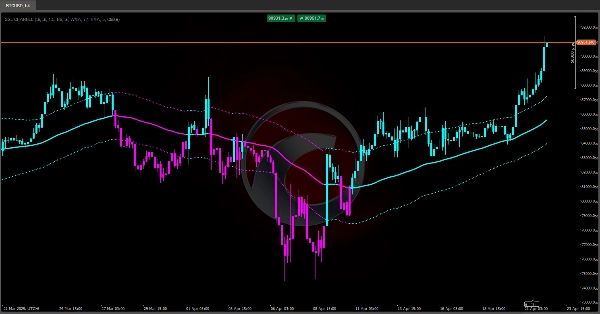
2.1. Ligne centrale ("Baseline")
• Calcule une moyenne mobile des prix (SMA, EMA, WMA ou Hull) pour lisser le bruit.
• Représente la valeur moyenne du marché, montrant la tendance dominante :
- Prix au-dessus → Tendance haussière. 🟢
- Prix en dessous → Tendance baissière. 🔴
2.2. Plage moyenne (ATR)
• Mesure la volatilité réelle du marché en moyennant les hauts/bas/fermetures précédents.
• ATR élevée = Plus de volatilité; ATR faible = Marchés plus calmes. 🌊
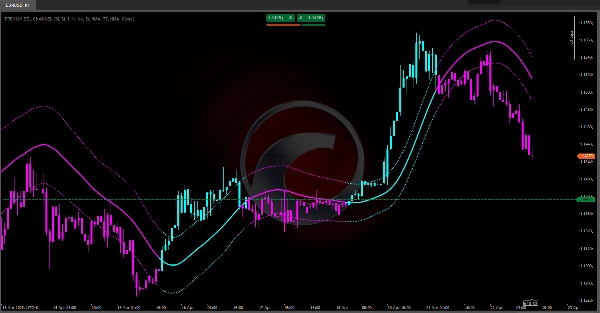
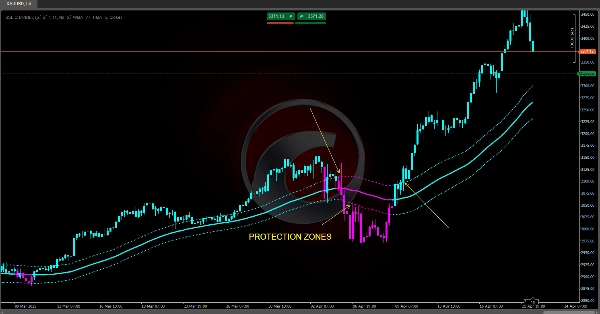
2.3. Bandes dynamiques ("Up ATR" & "Down ATR")
• Up ATR = Baseline + (ATR × Multiplicateur)
• Down ATR = Baseline – (ATR × Multiplicateur)
• Sert de canaux de prix :
- Prix touchant la bande supérieure → Force haussière. 🚀
- Prix proche de la bande inférieure → Momentum baissier. 🐻
2.4. Canal SSL (Signal-Smooth-Line)
• Utilise des moyennes mobiles sur les hauts/bas séparément.
• Logique de direction :
- Clôture au-dessus de la MA haute → Biais haussier. ✅
- Clôture en dessous de la MA basse → Biais baissier. ❌
- Entre les deux → Le biais précédent tient.
• Sert de filtre de tendance à court terme, confirmant/contredisant la Baseline. 🔄
3. Génération de signaux & utilisation pratique 🛠️
1. Confirmation de tendance
- Fortement haussier : Prix > Up ATR. 🟢
- Modérément haussier : Up ATR > Prix > Baseline.
- Modérément baissier : Baseline > Prix > Down ATR.
- Fortement baissier : Prix < Down ATR. 🔴
2. Filtre SSL
- Entrées : Aller long uniquement si le SSL est au-dessus de sa ligne (ou short s’il est en dessous). ⬆⬇
- Sorties : Sortie partielle/complète lorsque le SSL inverse et croise la MA haute/basse opposée. ✋
3. Coloration des barres
- Les barres de prix deviennent cyan (haussier) ou magenta (baissier), synchronisées avec la Baseline pour une lecture rapide du marché. 🎨
4. Paramètres configurables & impact ⚖️
• Période de la Baseline : Plus longue = plus lisse mais avec du retard ; plus courte = réactive mais bruyante. 🐢⚡
• Multiplicateur de bande : Plus élevé = canal plus large (moins de faux signaux) ; plus bas = plus serré (plus de signaux, plus de faux mouvements). ↔️
• Type de MA (SMA/EMA/WMA/HMA) : Affecte le poids des prix récents vs historiques. 📅
• Période & type SSL : Définit la sensibilité du filtre à court terme. 🎚️
Résumé
Avis clients
5 | 100 % | |
4 | 0 % | |
3 | 0 % | |
2 | 0 % | |
1 | 0 % |


