説明
🌟 フィボナッチ線形回帰🌟
フィボナッチ回帰バンドインジケーターは、回帰線の力とフィボナッチレベルを組み合わせて、金融市場のトレンド、サポート/レジスタンスゾーン、および潜在的な反転ポイントを特定する高度なテクニカルツールです。📈 このインジケーターは、複数の時間枠(5分、15分、30分、4時間)を同時に分析することで多次元的な視点を提供し、トレーダーがより正確に収束エリアを特定できるようにします。⏳
🎯 インジケーターは何をするのか?
このインジケーターは過去の価格データに基づいて回帰チャネルを作成し、それをフィボナッチリトレースメントレベルと統合して、主要な市場ゾーンの包括的な視覚マップを提供します。さまざまな時間枠を分析することで、長期トレンドと短期の価格動向を融合させた全体的な価格動向を示します。📊
🔍 主な構成要素
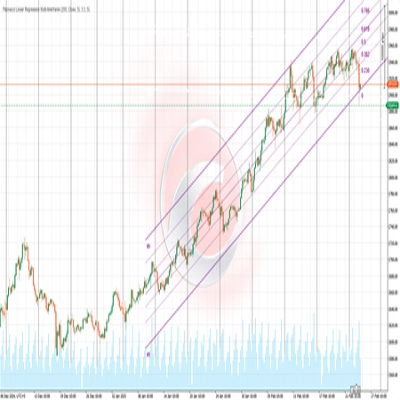
- 回帰チャネル: インジケーターはユーザー定義期間(デフォルト:200バー)にわたる線形回帰線を計算し、全体的な価格トレンドを示します。📉📈
- 偏差バンド: 中央の回帰線の周りに上下のバンドが描かれ、価格からの統計的偏差を表し、ボリンジャーバンドに似ていますが線形回帰に基づいています。📐
- フィボナッチレベル: チャネル内にクラシックなフィボナッチレベル(0、0.236、0.382、0.5、0.618、0.786、1)がプロットされ、反発または継続のポイントを提供します。🔢
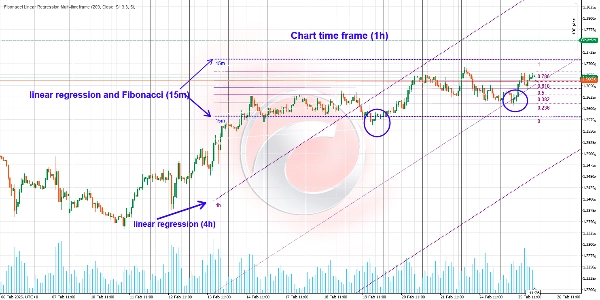
- マルチタイムフレーム分析: 5分、15分、30分、4時間の各時間枠を同時に分析し、それぞれ異なる色で表現することで、複数の時間枠が一致するゾーンを特定します。🎨
🔄 多次元市場分析
この戦略により、市場を複数の角度から見ることができ、長期トレンドと短期の価格変動を統合します。このアプローチにより、以下が可能になります:
- 市場の変化に応じて取引を動的に調整する。🔄
- 必要に応じて時間枠を切り替える。⏱️
- 主要トレンド内で大きな動きを捉える。🚀
- 小さな変動を利用してエントリーとエグジットのポイントを最適化する。🎯
🔄 時間枠間の相互作用
4時間足の回帰チャネル
- 支配的なトレンドの洞察を提供します。💪
- 市場の全体的な方向性を評価するための堅実な基盤を提供します。
- この文脈では、混雑を避けるためにフィボナッチレベルを無効にできます。
- 注目は支配的なトレンドを示す回帰チャネルにあります。
短い時間枠の回帰とフィボナッチ
- 短い時間枠(5分、15分、30分)で回帰線とフィボナッチレベルを有効にします。
- より広いトレンドの文脈内でより正確なシグナルを得ます。
- フィボナッチレベルは、より大きな時間枠内での潜在的なエントリーおよびエグジットポイントの特定に役立ちます。
📊 結果の解釈方法
トレンドの特定
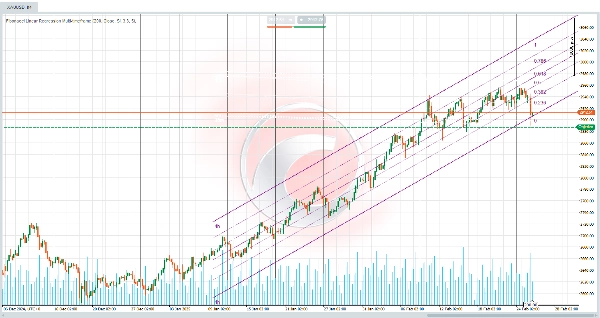
- 中央の回帰線の方向は支配的なトレンド(強気、弱気、横ばい)を示します。📈📉➡️
- 線の傾きはトレンドの強さを示唆し、傾きが急なほどトレンドが強いことを意味します。🔍
- 異なる時間枠の回帰線が同じ方向に収束することは、強力で信頼できるトレンドを示します。
サポートおよびレジスタンスゾーン
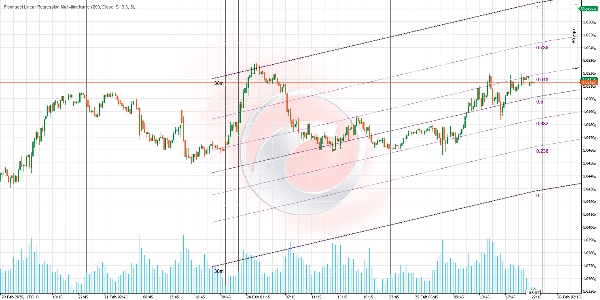
- 上下のバンドは動的なサポートおよびレジスタンスゾーンとして機能します。🛡️
- チャネル内のフィボナッチレベルは追加のサポート/レジスタンスを提供し、特に0.618および0.382で顕著です。
- 異なる時間枠のフィボナッチレベルが一致すると、高確率の収束ゾーンが形成されます。
🌐 収束ゾーンの特定
収束ゾーンは回帰線とフィボナッチレベルが重なる場所に発生します。これらのエリアは重要な価格反応の可能性が高いポイントを表します:
- フィボナッチリトレースメントが回帰チャネルの上端または下端と一致すると、強力なサポートまたはレジスタンスポイントとして機能します。
- 異なる時間枠の回帰線が交差または収束するとき。
- 複数の時間枠のフィボナッチレベルが特定のエリアで一致するとき。
- 価格が回帰チャネルの線と一致するフィボナッチレベルで正確に反発するとき。
🔄 反転ゾーンの特定
価格が小さい時間枠の回帰チャネルを突破し、重要なフィボナッチレベルに近づく場合、反転の可能性を示すことがあります。追加の反転サインには以下が含まれます:
- 過剰伸長:価格が上/下のバンドに達するか超える場合、特に複数の時間枠のフィボナッチレベルと一致するとき。
- モメンタム指標とのダイバージェンス:RSI、MACDなどの指標と併用することでダイバージェンス検出が強化されます。
- 中央線の突破:中央の回帰線を越えることは価格動態の変化を示す可能性があり、特に複数の時間枠で同時に発生するとき。
🧩 シナリオの多様性
複数の時間枠にわたる回帰チャネルとフィボナッチレベルのさまざまな組み合わせを使用することで、多様な取引シナリオを作成できます:
- 4時間足でロングポジションを維持しながら、同時に小さい時間枠でフィボナッチの反発を活用して取引する。
- 4時間の回帰チャネルを使って主要トレンドを特定し、小さい時間枠でフィボナッチレベルへのリトレースメント時に最適なエントリーを見つける。
- 複数の時間枠にわたる収束を利用して、高確率のエントリーおよびエグジットポイントを確認する。
📈 取引戦略
反転戦略
- 複数の時間枠からのフィボナッチレベルとバンドが収束するゾーンを特定する。
- 価格の確認(ローソク足パターン、ダイバージェンスなど)を待つ。
- 前のトレンドに逆らってエントリーし、タイトなストップロスを設定する。
- 次のフィボナッチレベルまたは中央の回帰線にターゲットを設定する。
継続戦略
- 中央線または主要なフィボナッチレベル(0.382または0.618)へのリトレースメントを探す。
- 複数の時間枠で全体のトレンドが維持されていることを確認する。
- これらのレベルで価格が反発したときにトレンド方向にエントリーする。
- 関連するフィボナッチレベルの下/上にストップロスを置く。
フィボナッチ線形回帰インジケーターを活用することで、トレーダーは市場の動態をより深く理解し、より情報に基づいた取引判断を下すことができます。鋭敏に、賢く取引しましょう!💻📈
Ctraderストアのインジケーター:
概要
This indicator performs simultaneous analysis across multiple timeframes—5-minute, 15-minute, 30-minute, and 4-hour—each displayed in distinct colors to identify confluence zones where signals from different timeframes align. The 4-hour timeframe focuses on the dominant trend using regression channels, while shorter timeframes include Fibonacci levels for precise entry and exit signals.
Traders can interpret the slope and direction of regression lines to assess trend strength and direction. Upper and lower bands act as dynamic support and resistance, with Fibonacci levels providing additional key zones. Confluence of regression lines and Fibonacci levels across timeframes highlights high-probability reaction points. The indicator supports reversal and continuation strategies by identifying key zones and confirming price action with multi-timeframe context.
カスタマーレビュー
5 | 100 % | |
4 | 0 % | |
3 | 0 % | |
2 | 0 % | |
1 | 0 % |


