説明
Pinescriptlabs ストア インジケーター: 🤖Pinescriptlabs ストア cBots : (cBot)
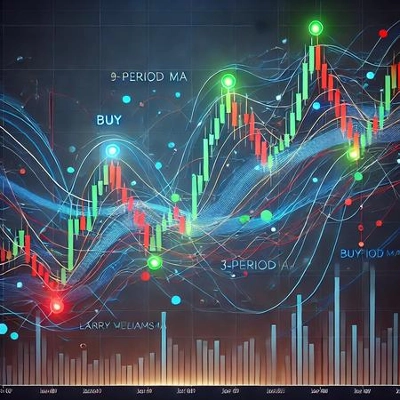
Gold & BTC ブレイクアウトセッション ピボット(新着)
ダイナミック
マーケット ストラクチャー
分析
の
ターニングポイント
Zスコアは価格を「標準
偏差」スケールに変換し、
各ローソク足の終値(または始値、高値、安値)が過去の平均からどれだけ離れているかを示します。直感的なビジュアルで、買われすぎ/売られすぎの
状態や
高確率の反転ゾーンを特定するのに役立ちます! 🔄
1️⃣ 何をするのか?
🔹 価格を標準化:絶対終値をZスコアに変換—過去
N本のバーの平均から何標準偏差離れているかを示します。
🔹 統計的極値を強調
:±1、±2、または±3付近の値は価格変動の希少性を示します:
- ±1 SD (約68%の確率で–1から1の間)
- ±2 SD (約95%の確率で–2から2の間)
- ±3 SD (約99.7%の確率で–3から3の間)
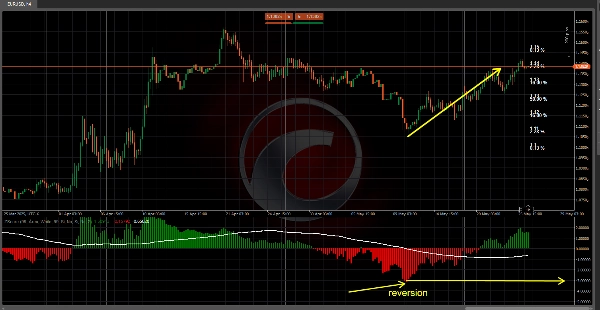
🔹 平均回帰取引を支援
:Zスコアが±2または±3を超えると、市場は極端な
ゾーンにあり、平均(ゼロ)に戻る傾向があります。
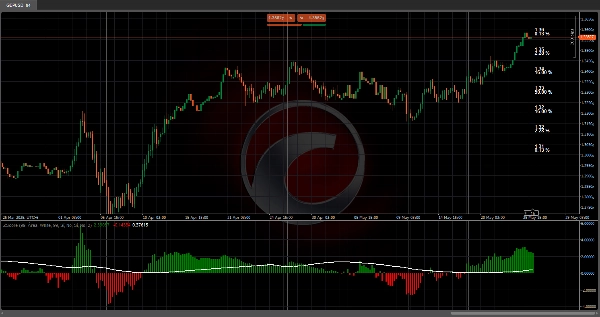
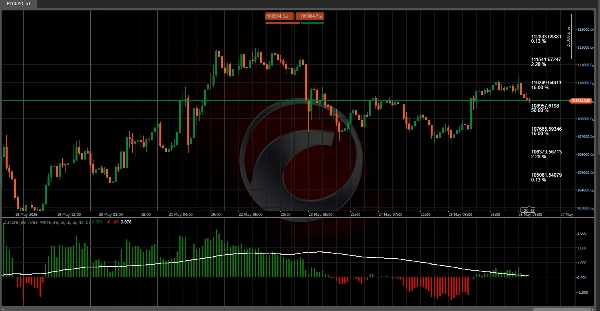
🔹 明確な
視覚化:ヒストグラム(または特別なローソク足)、移動平均線、色分けされたゾーンを使って、価格が「通常」か統計的な
外れ値かを瞬時に確認できます。
2️⃣ どのように機能するのか?
📐 平均と標準偏差の計算
- 過去の
期間(例:99本のバー)を使用します。 - 終値の平均と標準
偏差(SD)を計算します。 - SDが高いほど価格変動が大きいことを意味します。
🧮 Zスコアの公式
Z=現在の終値−過去の平均標準偏差Z=標準偏差現在の終値−過去の平均
- 正のZ→ 終値が平均より上にあります。
- 負のZ→ 終値が平均より下にあります。
📊 Zテーブルの確率
- 現在のZスコアの列を強調表示し、価格がどれほど希少/極端であるかを示します!
3️⃣ トレードでの使い方
✅ 平均回帰:Z > +2 または Z < –2 を見て反転を狙う(買われすぎの売り、売られすぎの買い)。
✅ トレンド確認:持続的なZ
> 0 + 上昇移動平均は強さを示し、
Z < 0 + 下降移動平均は弱さを示唆します。
✅ リスク管理:±1 SD付近では通常の動きを予想し、±3 SD付近ではストップやポジションサイズを慎重に調整します。
✅ エントリータイミング:極端なZスコアとサポート/レジスタンスレベルを組み合わせて正確なエントリーを行います。
4️⃣ 利点と注意点
✔️ 利点
- 極端な価格状態を見つける統計的優位性。
- 複数の表示モード(ヒストグラム、ローソク足、バンド、確率表)。
- 簡単なカスタマイズ(長さ、色、チャートタイプ)。
⚠️ 注意点:
- 強い
トレンドでは、価格が長期間「極端」な状態のまま反転しないことがあります。 - 正規分布を前提としているため、
非常に変動が大きい/歪んだ市場ではうまく機能しない場合があります。 - 安定した
ボラティリティ環境での使用が最適です。
概要
The indicator calculates the mean and standard deviation of recent closing prices to determine the Z-Score using the formula:
Z = (Current Close − Historical Mean) / Standard Deviation.
Positive Z-Scores indicate prices above the mean, while negative scores indicate prices below it.
ZScore Reversion provides clear visualizations through histograms, special candles, moving averages, and colored zones to distinguish normal price behavior from statistical outliers. It supports mean reversion trading by signaling when prices exceed ±2 or ±3 standard deviations, suggesting a likely return to the mean. It also aids trend confirmation by interpreting sustained positive or negative Z-Scores combined with moving average trends.
Risk management is facilitated by adjusting stops and position sizes near extreme Z-Score values. Entry timing can be refined by combining extreme Z-Scores with support and resistance levels. The indicator offers multiple display modes and customization options for length, colors, and chart types. It is best suited for stable volatility environments and assumes a normal distribution of price data.
カスタマーレビュー
5 | 100 % | |
4 | 0 % | |
3 | 0 % | |
2 | 0 % | |
1 | 0 % |