
説明
すべての4つのOHLC価格に移動平均を使用した動的価格チャネルによる完全な市場構造分析。
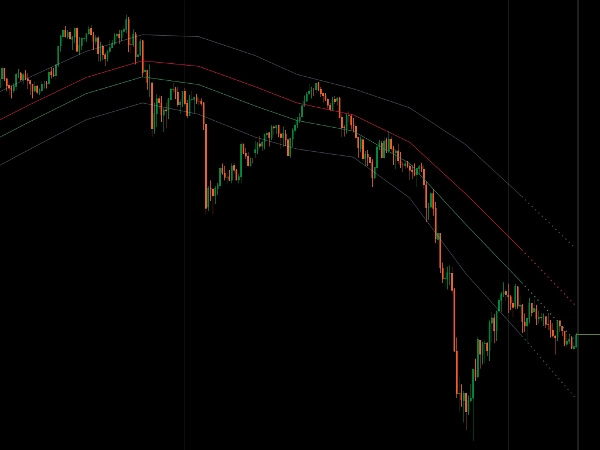
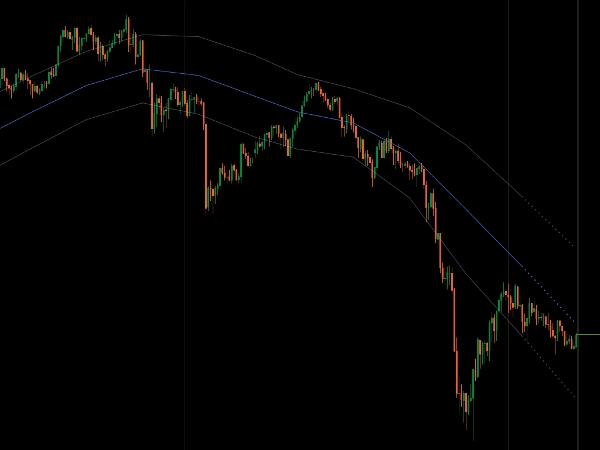
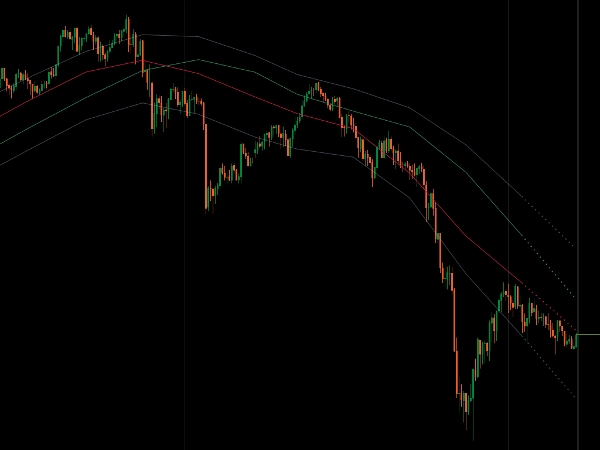
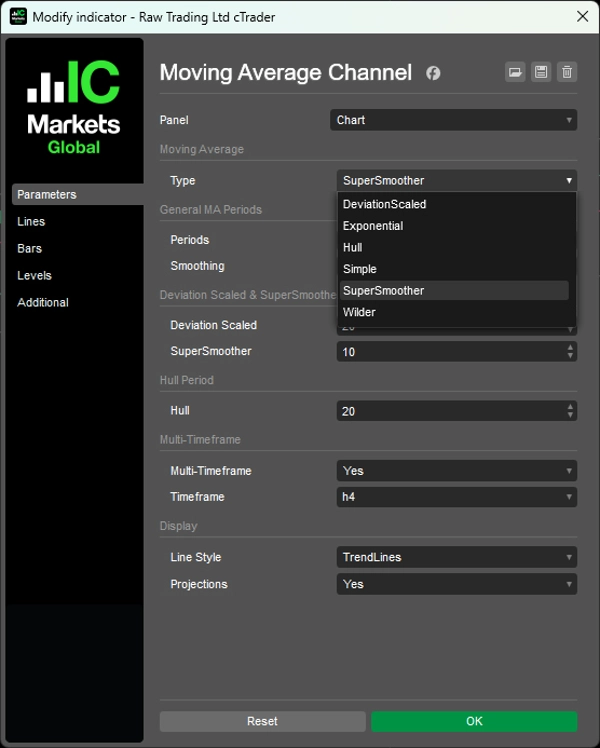
選択したMAタイプ(単純、指数、ワイルダー、偏差スケール、スーパー・スムーザー、ハル)を高値/安値の境界、始値/終値の方向性バイアス、および中央値の均衡線に適用し、一体的なチャネルの視覚化を実現します。
組み込みのフィボナッチ反転ゾーン(38.2%、61.8%)、SMA/EMAのための二重スムージングレイヤーによる超クリーンなチャネル作成、伝統的な階段状または斜めのトレンドラインモードによるマルチタイムフレーム表示、スマートなモメンタムベースの予測、および境界拒否検出により、平均回帰とトレンド強度評価をターゲットとするトレーダーに包括的なチャネル構造を提供します。
特徴
完全な価格構造
- 高値/安値がチャネルの境界を定義
- 始値/終値が方向性バイアスを示す
- 中央値線:高値/安値の間の50%レベル—市場バランスの真の中心
- 4つの価格が連携して完全な市場の全体像を示す
組み込みの反転ゾーン
- フィボナッチ38.2%および61.8%レベルは統計的に重要なプルバック領域を示す
- 価格変動に適応する動的ゾーン
- 明確なエントリーおよびエグジットの参照ポイント
6種類の移動平均
- 単純、指数、ワイルダー、偏差スケール、スーパー・スムーザー、ハル
- SMA/EMAの二重スムージング:期間+追加のスムージングレイヤーで超クリーンなチャネルを実現
- 高度なアルゴリズム:偏差スケールはボラティリティに適応、スーパー・スムーザーは遅延を除去、ハルは最近の価格動向を強調
トレンドライン付きマルチタイムフレーム
- 低い時間軸のチャートで高い時間軸のチャネルを表示
- 2つの表示モード:伝統的な階段状ラインまたは斜めのトレンドライン(MTFのみ)
- ラインはMTFバーの終値を結び、クリーンな斜め構造を形成
- スマートな予測が現在のモメンタムに基づきチャネルの進行方向を示す
クリーンな視覚システム
- チャネルの傾きがモメンタムを示す
- 価格の位置がトレンドの強さを示す
- 境界の拒否が潜在的な反転を示唆
- 完全な市場構造分析のための1つのインジケーター
__________________________________________________________________________________________
その他の無料インジケーター
構造やボリュームから回帰、ボラティリティ、カスタム時間軸まで、幅広い市場分析ツールを探求してください。
ソースコードはGitHub リポジトリで利用可能です。
すべて無料で使用できます。ただし、コーヒーサポートを送りたい場合は、こちらからどうぞ。
サポート/レジスタンス
ボリューム
移動平均
- SSLチャネル
- アンカード移動平均
- 偏差スケール移動平均
- ギャン高安アクティベーター
- 瞬時トレンドライン
- トレンドビジョン付きカウフマン適応MA
- 移動平均チャネル
- 移動平均スイート
- トレンドチャネル移動平均
ユーティリティ/カスタム
回帰ベース
ボラティリティ
オシレーター
__________________________________________________________________________________________
免責事項
取引にはリスクが伴います。このインジケーターはあくまでテクニカル分析用であり、常に適切なリスク管理を行い、責任を持って取引してください。
フィードバックと改善
ご提案、機能リクエスト、改善アイデアがあれば、ディスカッションタブにコメントを残してください。皆様のフィードバックがインジケーターの改善に役立ちます。
概要
The indicator incorporates built-in Fibonacci reversion zones at 38.2% and 61.8%, which dynamically adjust with price movement to highlight significant pullback areas and provide clear entry and exit reference points. It supports multi-timeframe analysis, allowing higher timeframe channels to be displayed on lower timeframe charts, with two visualization modes: traditional stairstep lines or diagonal trendlines connecting multi-timeframe bar closes. Smart momentum-based projections indicate potential channel direction, while boundary rejection detection signals possible reversals.
This tool offers a cohesive visual system where channel slope reflects momentum and price position indicates trend strength, enabling traders to assess trend direction, momentum shifts, and mean reversion zones across various markets including Forex, Indices, Commodities, Crypto, and Stocks.


