説明
更新版利用可能 — こちら
このインジケーターの更新版が重要な修正と改善を伴ってリリースされました:
- ボリューム分布の修正:キャンドルの重なりに基づく比例配分(すべての触れたレベルに100%ではなく)
- VAH/VAL検出の修正:許容範囲が固定値ではなくレベルの高さに応じてスケールされるように
- テキスト位置の修正:固定日数ではなく動的な時間枠ベースのオフセット
- タイムゾーンオフセットパラメーター:DateTimeプロファイル用
- テキスト位置パラメーター:ルックバックモードの左右配置オプション
- パフォーマンス改善:DateTime検索の二分探索、キャッシュされたボリューム計算、最適化された辞書操作
__________________________________________________________________________________________
重要な注意事項 - まずお読みください
FXのボリュームは実際のボリュームではありません
FXのボリュームはティックボリュームです — 価格が何回変化したかをカウントします。取引された金額をカウントするものではありません。
ティックボリュームが示せないこと
- 取引サイズ。100ドルの取引も1,000万ドルの取引もどちらも1ティックとしてカウントされます。
- 実際の資金の流れ。大口資金か小口資金が価格を動かしたかはわかりません。
- 真の流動性。市場にどれだけの注文が待機しているかは見えません。
- 銀行の活動。銀行は実際のボリュームデータを見ています。あなたは見ていません。
これが意味すること
ティックボリュームは価格がどれだけ頻繁に変化したかだけを示し、その背後の資金量は示しません。これにより問題が生じます:
- 銀行や機関投資家を追跡できません。彼らはあなたがアクセスできない実際のボリュームデータを使用しています。
- 「スマートマネー」理論を証明できません。これらの考えは実際のボリュームが必要で、ティックカウントではありません。
- 真の流動性を判断できません。ティック活動は注文の深さや市場の実力を示しません。
- 実際の買いまたは売りの力を測れません。多くの小さな取引は一つの大きな機関取引と同じように見えます。
- ボリュームの急増は誤解を招くことがあります。急増は実際の取引関心ではなくアルゴリズムのノイズかもしれません。
このインジケーターの正しい使い方
- 資金計測器ではなく活動計測器として扱ってください。高いティックボリューム=市場が活発。低いティックボリューム=市場が静か。それ以上の意味はありません。
- 異なる時間帯の活動を比較してください。ロンドンセッションがニューヨークより忙しいか?今日が昨日より活発か?トレンド期間がレンジより忙しいか?を見るために使います。
- 価格構造と組み合わせて使います。サポート/レジスタンス、スイングポイント、BOS/ChoCHとボリュームを一緒に使うことで、ノイズの多いボリューム急増からの誤信号を防ぎます。
- 重要な価格レベルでの活動を観察してください。価格が重要なレベルをテストしティックボリュームが増加した場合、より多くのトレーダーが活動していることを意味します。大口プレイヤーが関与しているわけではありません。
- 機関投資家の活動を示していると仮定しないでください。ティックボリュームは蓄積、大口注文、「スマートマネー」を示せません。リズムとテンポを測るためだけに使ってください。
__________________________________________________________________________________________
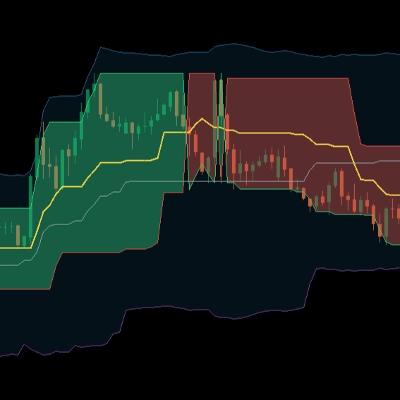
POC、バリューエリア、市場プロファイルTPOトラッキングでボリューム分布と価格滞在時間を視覚化します。
このインジケーターはマーケットプロファイルの概念を用いてボリューム分布を表示します。コントロールポイント(最高のティック活動レベル)、バリューエリア境界(最も取引が行われた場所)、TPO文字列(各価格での滞在時間)、およびキャンドルの方向別にティック活動を分割するデルタの視覚化を表示します。
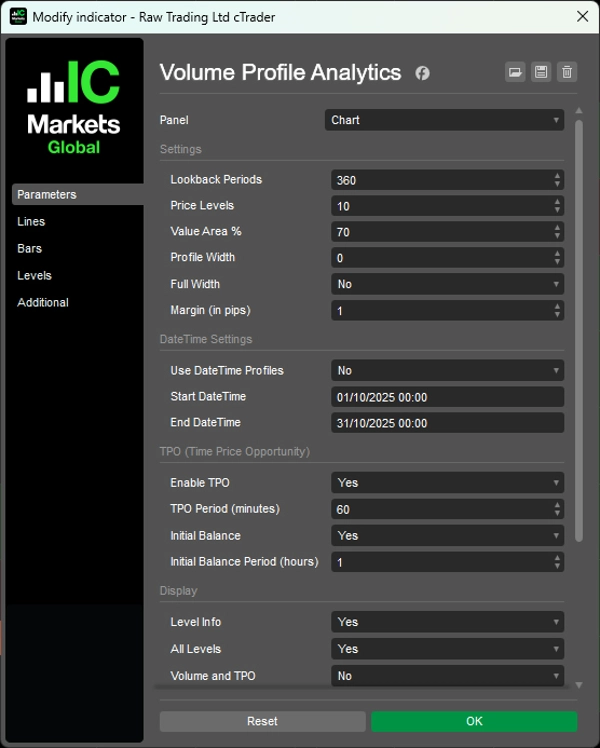
ルックバック期間を選択したり、特定の日付範囲を設定したり、ボリュームバーを比例表示または全幅表示に切り替えたり、すべてのレベルまたは主要レベルのみを切り替えたり、強気/弱気の活動の色をカスタマイズしたりできます。
特徴
ボリューム分布分析
- コントロールポイント(POC):最も活動が多い価格レベル—価格が最も長く滞在した場所
- バリューエリア(VA):カスタマイズ可能な活動集中ゾーン(デフォルト70%)—最も取引が行われた場所
- VAH/VAL:バリューエリアの高値/安値境界—潜在的なサポート/レジスタンスレベル
- デルタ視覚化:各価格レベルでのキャンドル方向を分割表示
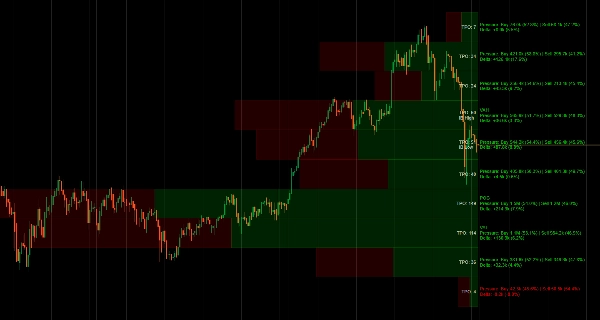
マーケットプロファイルTPO
- タイムプライスオポチュニティトラッキング:各価格で取引された時間帯の数をカウント
- TPO文字:価格での滞在時間の視覚的表現(A-Zのシーケンス)
- 初期バランス(IB):最初の1時間のレンジ—デイトレード構造に重要
- IB高値/安値マーカー:オープニングレンジの極値
柔軟なルックバックオプション
- 期間ベース:分析するバー数を設定(例:直近120バー)
- DateTime範囲:特定の日付/時間間でプロファイルをアンカーしイベント分析に使用
- 動的幅:自動スケールまたは固定幅プロファイル
表示オプション
- ボリュームバー:比例幅(活動に応じてスケール)または全幅均一バー
- 各バー内でのキャンドル方向の分割
- パーセンテージ付きデルタ計算
- すべてのレベルまたは主要レベルのみの切り替え(POC、VAH、VAL)
- ボリューム/TPO詳細の表示制御
- パーセンテージ付き方向別内訳
- 調整可能なフォントサイズとピップベースのマージン
色のカスタマイズ
- 強気/弱気方向バーの独立した色設定
- 正のデルタ/負のデルタの別々のテキスト色
- TPO専用のテキスト色
パフォーマンス最適化
- キャッシュされた時間検索と効率的な矩形描画
- スムーズなパフォーマンスのための最小限の再計算
- キャンドル構造に基づくプロフェッショナルグレードのデルタ計算
__________________________________________________________________________________________
その他の無料インジケーター
構造やボリュームから回帰、ボラティリティ、カスタム時間枠まで幅広い市場分析ツールを探索してください。
ソースコードはGitHub リポジトリで利用可能です。
すべて無料で使用できますが、コーヒーサポートを送りたい場合は こちらからどうぞ。
サポート/レジスタンス
ボリューム
移動平均
ユーティリティ/カスタム
回帰ベース
ボラティリティ
オシレーター
__________________________________________________________________________________________
免責事項
取引にはリスクが伴います。このインジケーターはテクニカル分析のみを目的としており、常に適切なリスク管理を行い、責任を持って取引してください。
フィードバックと改善
ご提案、機能リクエスト、改善アイデアがあれば、ディスカッションタブにコメントを残してください。皆様のフィードバックはインジケーターの改善に役立ちます。
概要
Users can customize lookback periods by number of bars or specific date/time ranges and choose between proportional or full-width volume bars. The indicator also provides delta visualization, splitting tick activity by candle direction with percentage breakdowns, and offers extensive display and color customization options for bullish and bearish activity.
This tool is optimized for performance with cached calculations and efficient drawing methods. It is designed to measure market activity rhythm and tempo based on tick volume, which counts price changes but does not represent actual traded money or liquidity. It is suitable for analyzing volume distribution and market structure across various trading sessions and timeframes.
カスタマーレビュー
5 | 100 % | |
4 | 0 % | |
3 | 0 % | |
2 | 0 % | |
1 | 0 % |