Beschreibung
Pinescriptlabs Store Indikatoren: 🤖Pinescriptlabs Store cBots : (cBot)
Gold & BTC BreakoutSession Pivots(neu)
SmartTrend Support &
Resistance
Lines
Dynamische
Marktstruktur
Analyse
von
Wendepunkten
Fibonacci
Lineare
Regression
Multi-Zeitrahmen
Multi-Level
Kerzen-Bias
Tracker
Reaktive gleitende Durchschnitt
Auto
Support und
Resistance
Trend
Linien
Alle
Support und
Resistance
Niveaus
Der Z-Score transformiert den Preis in eine "Standard
Abweichungs"-Skala,
die zeigt, wie weit der Schlusskurs (oder Eröffnung, Hoch, Tief) jeder Kerze von seinem
historischen Mittelwert abweicht. Mit einer intuitiven Visualisierung hilft es, überkaufte/überverkaufte
Zustände und
hochwahrscheinliche Umkehrzonen zu identifizieren! 🔄
1️⃣ Was macht es?
🔹 Standardisiert den Preis: Wandelt den absoluten Schlusskurs in einen Z-Score um — wie viele Standardabweichungen er vom Mittelwert
der letzten N Kerzen entfernt ist.
🔹 Hebt hervor
statistische Extreme: Werte
nahe ±1, ±2 oder ±3 deuten auf seltene Preisbewegungen hin:
- ±1 SD (≈ 68% Wahrscheinlichkeit zwischen –1 und 1)
- ±2 SD (≈ 95% Wahrscheinlichkeit zwischen –2 und 2)
- ±3 SD (≈ 99,7% Wahrscheinlichkeit zwischen –3 und 3)
🔹 Hilft
beim Mean Reversion Trading:
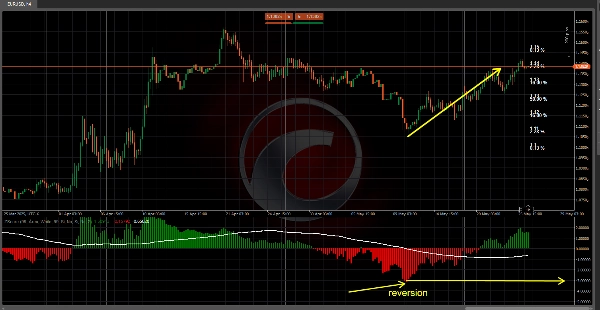
Wenn der Z-Score ±2 oder ±3 überschreitet, befindet sich der Markt in einer extremen
Zone und tendiert dazu,
zum Mittelwert (Null) zurückzukehren.
🔹 Klare
Visualisierung: Mithilfe von Histogrammen (oder speziellen Kerzen), einer gleitenden Durchschnittslinie und farbigen Zonen können Sie sofort erkennen, ob der Preis sich "normal" verhält oder ein statistischer
Ausreißer ist.
2️⃣ Wie funktioniert es?
📐 Berechnung von Mittelwert & Standardabweichung
- Eine
Lookback-Periode (z.B. 99
Kerzen) wird verwendet. - Der Mittelwert und die Standard
abweichung (SD) der
Schlusskurse werden berechnet. - Höhere SD = Mehr Volatilität bei den Preisbewegungen.
🧮 Z-Score Formel
Z=Aktueller Schlusskurs−Historischer MittelwertStandard AbweichungZ=Standard AbweichungAktueller Schlusskurs−Historischer Mittelwert
- Positiver Z → Schlusskurs über dem Mittelwert.
- Negativer Z → Schlusskurs unter dem Mittelwert.
📊 Z-Tabellen Wahrscheinlichkeiten
- Hebt die
Spalte des aktuellen Z-Scores hervor, um zu zeigen, wie selten/extrem der Preis ist!
3️⃣ Wie man es im Trading verwendet
✅ Mean Reversion: Suchen Sie nach Z > +2 oder Z < –2 um Umkehrungen zu handeln (verkaufen bei überkauften
Extremen, kaufen bei überverkauften Extremen).
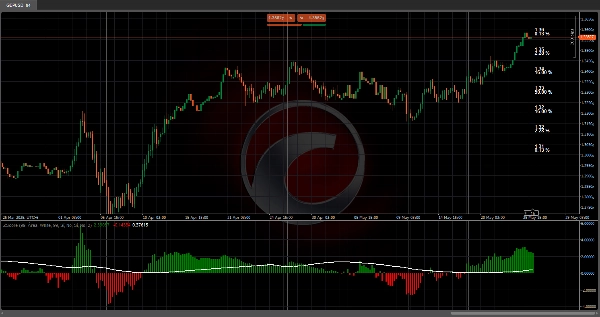
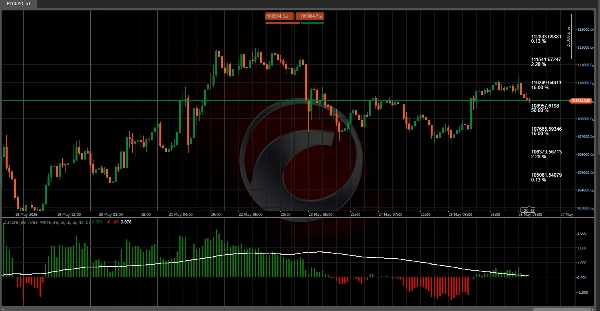
✅ Trendbestätigung: Ein anhaltender Z
> 0 + steigender gleitender Durchschnitt signalisiert
Stärke; Z < 0 + fallender GD deutet auf Schwäche hin.
✅ Risikomanagement: In der Nähe von ±1 SD, erwarten Sie normale Bewegungen; in der Nähe von ±3
SD, passen Sie Stops &
Positionsgrößen sorgfältig an.
✅ Einstiegszeitpunkt: Kombinieren Sie extreme Z-Scores mit Support-/Resistance-
Niveaus für präzise
Einstiege.
4️⃣ Vorteile & Überlegungen
✔️ Vorteile
- Statistischer Vorteil bei der Erkennung extremer Preisbedingungen.
- Mehrere Anzeigemodi (Histogramm, Kerzen, Bänder, Wahrscheinlichkeits
tabelle). - Einfache Anpassung (Länge, Farben, Diagrammtyp).
⚠️ Überlegungen:
- In starken
Trends kann der Preis für lange Zeit "extrem" bleiben, ohne sich umzukehren. - Geht von einer normalen
Verteilung aus — funktioniert möglicherweise nicht gut in hochvolatilen/verzerrten Märkten. - Am besten in stabilen
Volatilitätsumgebungen verwenden.
Zusammenfassung
The indicator calculates the mean and standard deviation of recent closing prices to determine the Z-Score using the formula:
Z = (Current Close − Historical Mean) / Standard Deviation.
Positive Z-Scores indicate prices above the mean, while negative scores indicate prices below it.
ZScore Reversion provides clear visualizations through histograms, special candles, moving averages, and colored zones to distinguish normal price behavior from statistical outliers. It supports mean reversion trading by signaling when prices exceed ±2 or ±3 standard deviations, suggesting a likely return to the mean. It also aids trend confirmation by interpreting sustained positive or negative Z-Scores combined with moving average trends.
Risk management is facilitated by adjusting stops and position sizes near extreme Z-Score values. Entry timing can be refined by combining extreme Z-Scores with support and resistance levels. The indicator offers multiple display modes and customization options for length, colors, and chart types. It is best suited for stable volatility environments and assumes a normal distribution of price data.
Kundenbewertungen
5 | 100 % | |
4 | 0 % | |
3 | 0 % | |
2 | 0 % | |
1 | 0 % |


![„[Stellar Strategies] Smart ADX“-Logo](https://cdn.ctrader.com/image/webp/af13b084-b6f6-41db-b7bc-c7e688b57b05_36929)


![„[Hamster-Coder] Moving Average“-Logo](https://cdn.ctrader.com/image/webp/1bd952ad-57d2-4db2-9b49-b01be0b048b8_30113)