説明
拡張版利用可能 — こちら
現在、オリジナルバージョンを表示しています。このインジケーターの拡張版は、以下の追加機能とともにリリースされています:
- 強化された年齢表示: 年、月、週、日形式(例:「3年 2週 4日」)
- すべてのFVGを表示: 「表示するFVG」を-1に設定すると、無制限の過去FVGを表示
- 塗りつぶされたFVGの延長: 塗りつぶされたFVGボックスを現在のバーまで延長するオプション
- フィボナッチレベル: 部分的および塗りつぶされたFVGに自動レベル(23.6%、38.2%、50%、61.8%、78.6%)
- 部分的塗りつぶしの閾値: カスタマイズ可能な閾値(50-99%、デフォルト90%)
__________________________________________________________________________________________
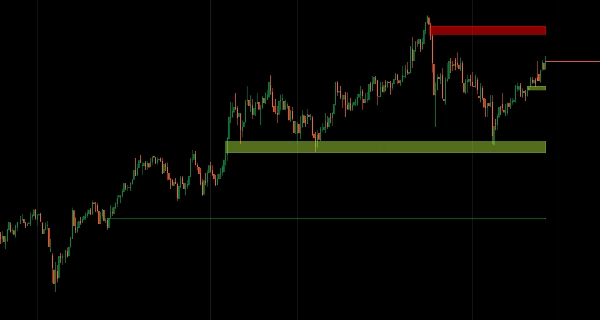
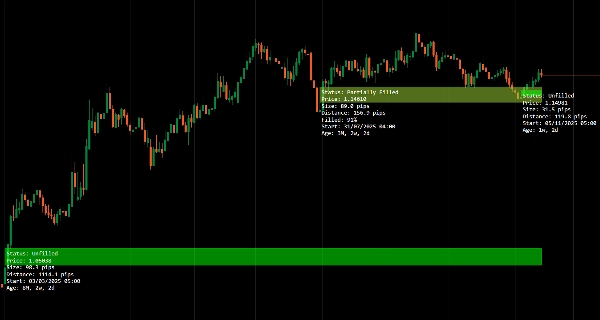
年齢追跡と塗りつぶし状況の監視でフェアバリューギャップを特定。
強気および弱気のギャップを自動検出し、塗りつぶしの状態(未塗りつぶし、部分的、完全塗りつぶし)をリアルタイムで追跡し、優先順位付けのためにギャップの年齢を表示します。
マルチタイムフレームスキャンにより、高時間軸の構造的ギャップと低時間軸の価格動向を整合させ、価格がゾーンと相互作用する際に動的に状態を更新し、最小限の非侵襲的ラベリングで、ギャップの塗りつぶしや構造に基づくエントリーを目指すトレーダーに焦点を当てた流動性の不均衡分析を提供します。
機能
FVGの識別
- 強気および弱気のフェアバリューギャップを自動検出
- 未塗りつぶし、部分的塗りつぶし、完全塗りつぶしの状態をリアルタイムで追跡
- チャートの乱雑さを最小限に抑えたクリーンな視覚表示
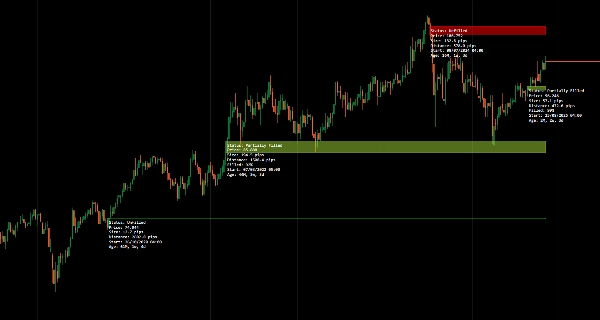
年齢ラベリング
- 各ギャップが形成されてから経過した時間を表示
- 新鮮なギャップと古いギャップの優先順位付けに役立つ
- 時間の文脈がギャップの関連性の判断を向上
状態追跡
- 現在の塗りつぶし状態を表示:未塗りつぶし、部分的塗りつぶし、完全塗りつぶし
- 価格がギャップと相互作用するにつれて動的に更新
- 流動性の捕捉を視覚的に確認
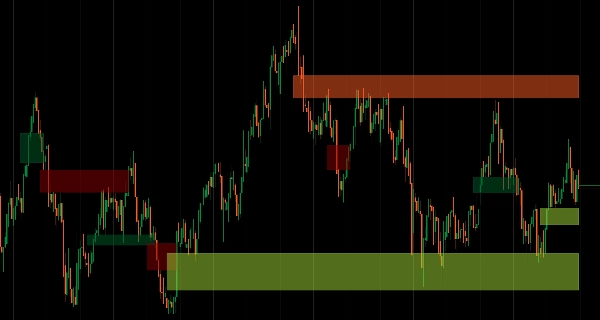
マルチタイムフレームモード
- 低時間軸チャート上で高時間軸のFVGをスキャンおよび表示
- 高時間軸の構造的ギャップと低時間軸の価格動向を整合
- マルチタイムフレーム分析のワークフローを改善
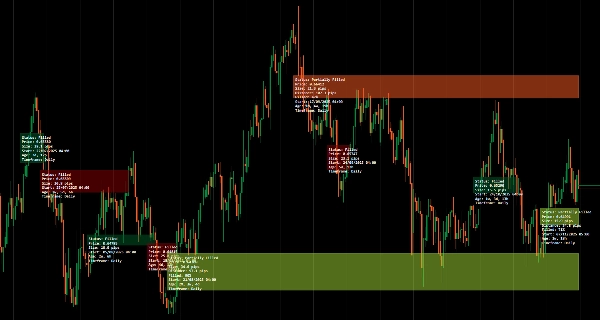
クリーンでミニマルなUI
- 明瞭さを重視した非侵襲的なラベル
- 価格表示を乱雑にせず情報提供
- 集中した分析のためのプロフェッショナルなプレゼンテーション
__________________________________________________________________________________________
その他の無料インジケーター
構造やボリュームから回帰、ボラティリティ、カスタムタイムフレームまで、幅広い市場分析ツールを探索してください。
ソースコードはGitHub リポジトリで利用可能です。
すべて無料で使用できますが、コーヒーサポートを送りたい場合は こちらからどうぞ。
サポート/レジスタンス
ボリューム
移動平均
ユーティリティ/カスタム
回帰ベース
ボラティリティ
オシレーター
__________________________________________________________________________________________
免責事項
取引にはリスクが伴います。このインジケーターはテクニカル分析専用です。常に適切なリスク管理を行い、責任を持って取引してください。
フィードバックと改善
ご提案、機能リクエスト、改善案がある場合は、ディスカッションタブにコメントを残してください。皆様のフィードバックはインジケーターの改善に役立ちます。
概要
カスタマーレビュー
5 | 100 % | |
4 | 0 % | |
3 | 0 % | |
2 | 0 % | |
1 | 0 % |