
설명
🌟 **Z-점수란 무엇인가요?** 🌟
• **거래에서의 Z-점수**: 현재 가격이 최근 평균에서 얼마나 떨어져 있는지를 표준 편차 단위로 측정하는 방법입니다. 😊 값이 0에 가까우면 가격이 평균 근처에 있음을 나타내고, 높은 값(양수 또는 음수) 😮 은 크게 벗어났음을 의미합니다.
• **통계적 유용성**: 이 값들은 가격이 "과매수" 📈 또는 "과매도" 📉 상태인 상황을 식별할 수 있게 해주며, 이는 평균 회귀 전략이나 높은 변동성 💥 시점을 감지하는 데 유용합니다.
🌟 **지표 작동 방식** 🌟
1. **평균 및 편차 계산**:
- 특정 이전 바(또는 기간) 수를 분석하여 평균 종가와 표준 편차를 계산합니다. 🧮
- 이 값들로 현재 가격이 평균에서 얼마나 벗어났는지 결정하며, 이 차이를 Z-점수로 표현합니다.
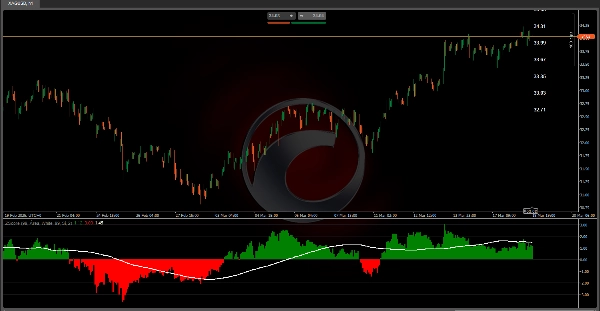
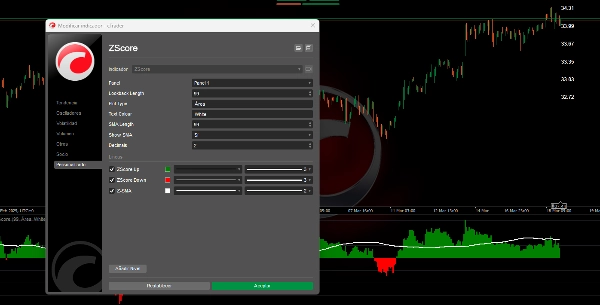
2. **Z-점수 시각화**:
- **영역 모드**: 두 개의 히스토그램이 표시됩니다: 평균 위에 있을 때 양수 값은 녹색 🟩, 평균 아래일 때 음수 값은 빨간색 🔴 으로 나타내어 편차의 크기와 방향을 시각적으로 식별할 수 있습니다.
3. **Z-점수 이동 평균**:
- Z-점수 값에 대해 이동 평균을 계산합니다. 이는 변동을 부드럽게 하고 가격 편차가 시간에 따라 어떻게 변하는지 추세를 파악하는 데 도움을 줍니다. 📊
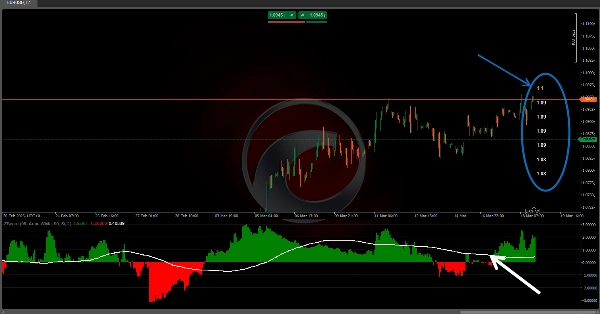
4. **확률 구역 및 참조 레이블**:
- 또한 차트에 평균과 각 편차 수준에 해당하는 가격을 표시하는 레이블이 배치됩니다. 이는 가격 측면에서 시장이 얼마나 "극단적"으로 움직이고 있는지 이해하는 데 유용합니다. ⚠️
---
🌟 **트레이더를 위한 해석 및 적용** 🌟
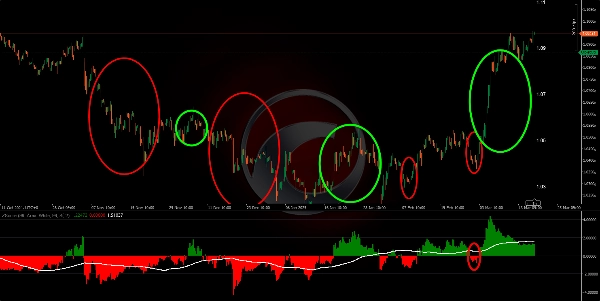
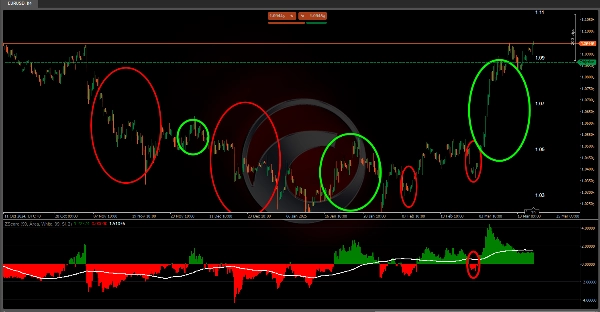
• **극단값 감지**: 지표에서 매우 높거나 낮은 값을 관찰함으로써 트레이더는 가격이 평균에서 크게 벗어났음을 식별할 수 있습니다. 이는 평균 회귀를 기대할 경우 조정이 있을 가능성 🔄 을 시사하거나 강한 돌파가 일어나고 있음을 나타낼 수 있습니다.
• **추세 확인**: Z-점수의 이동 평균과 관련 밴드를 통해 가격 행동 추세가 평균에 대해 어떻게 변하는지 볼 수 있습니다. 이 선들의 교차나 변화는 진입 🛡️ 또는 청산 신호로 해석될 수 있습니다.
• **위험 관리**: 편차 수준과 확률 구역을 알면 포지션 크기를 조정하거나 손절매 ⬇️ 및 이익 실현 ⬆️ 지점을 정의할 수 있습니다. 이는 정상 움직임과 극단적 움직임에 대한 기준을 제공하기 때문입니다.
• **시장에 대한 통계적 이해**: 단순한 그래픽 도구를 넘어서, 이 지표는 시장 행동을 확률적 관점에서 생각하도록 유도합니다. 움직임의 "정상성"을 아는 것은 거래 기회를 평가할 때 결정적인 요소가 될 수 있습니다. 🎯
🌟 **결론** 🌟
이 알고리즘은 가격 데이터를 통계적 표현으로 변환하여 최근 행동에 대한 가격 편차를 시각화하고 정량화하는 데 도움을 줍니다. Z-점수, 이동 평균, 편차 밴드, 확률 표를 결합함으로써 지표는 여러 층의 정보를 제공합니다. 이는 특히 시장이 비정상적인 상태에 있을 때를 식별하는 데 가치가 있으며, 확률과 통계에 기반한 진입 🚀, 청산 🛑 및 위험 관리 결정을 용이하게 합니다. 📈📉
Ctrader Store 지표:
요약
고객 리뷰
5 | 100 % | |
4 | 0 % | |
3 | 0 % | |
2 | 0 % | |
1 | 0 % |


!["[Stellar Strategies] Smart ADX" 로고](https://cdn.ctrader.com/image/webp/af13b084-b6f6-41db-b7bc-c7e688b57b05_36929)


