
Penerangan
Purata bergerak berasaskan kecekapan yang menyesuaikan kelajuan pelicinan secara dinamik berdasarkan keadaan pasaran.
Mengira pelicinan melalui Nisbah Kecekapan (pergerakan berarah berbanding jumlah volatiliti), bertindak balas dengan cepat dalam tren dan meratakan semasa bunyi untuk mengelakkan whipsaw.
Visualisasi warna tiga keadaan (Hijau tren menaik, Merah tren menurun, Biru Muda julat), parameter kepekaan yang boleh dikonfigurasikan (Tempoh, pelicinan Pantas/Lambat, ambang ER), penukaran automatik antara mod pantas dan lambat, dan tingkah laku sokongan/rintangan dinamik memberikan penjejakan tren adaptif untuk pedagang yang memerlukan kepekaan dalam pasaran berarah dan kestabilan semasa pengukuhan.
CIRI-CIRI
Algoritma Adaptif
- Kelajuan pelicinan berubah berdasarkan Nisbah Kecekapan (ER)—nisbah pergerakan berarah kepada jumlah volatiliti
- Bertindak balas dengan cepat apabila kecekapan meningkat
- Meratakan apabila harga bising untuk mengelakkan whipsaw
- Jarak dinamik dari harga berdasarkan tingkah laku pasaran
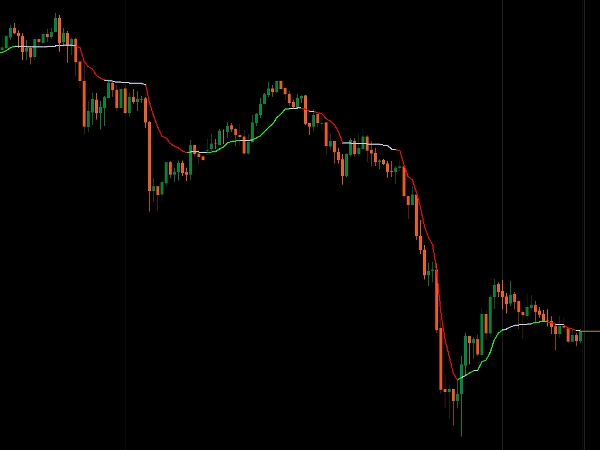
Visualisasi Tiga Keadaan
- Hijau: Tren menaik kuat (ER di atas ambang + meningkat)
- Merah: Tren menurun kuat (ER di atas ambang + menurun)
- Biru Muda: Julat/bergelora (ER di bawah ambang)
- Pengesahan visual segera keadaan pasaran
Kepekaan Boleh Dikonfigurasikan
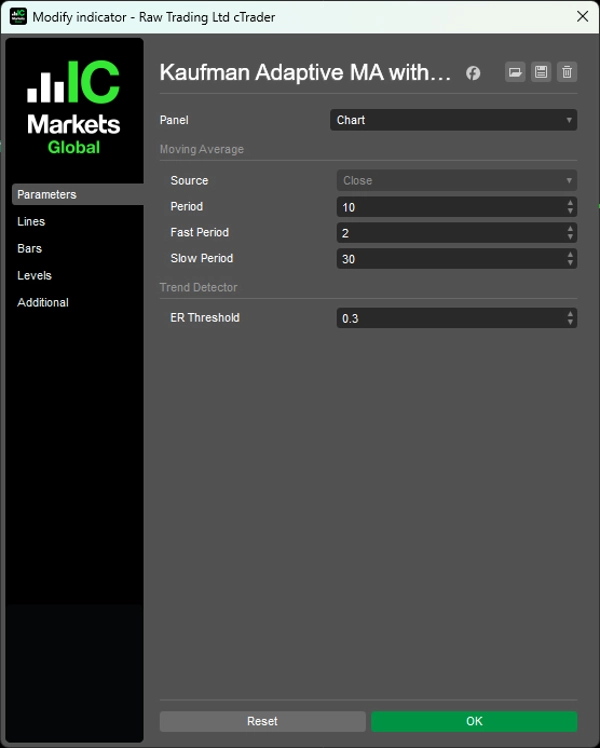
- Tempoh: Peninjauan semula untuk pengiraan kecekapan (lalai: 10)
- Tempoh Pantas: Pelicinan dalam tren kuat (lalai: 2)
- Tempoh Lambat: Pelicinan dalam pasaran julat (lalai: 30)
- Ambang ER: Kecekapan minimum untuk layak sebagai tren (lalai: 0.3)
Penyesuaian Pintar
- Beralih secara automatik antara pelicinan pantas dan lambat
- Menapis bunyi dalam pasaran bergelora
- Menangkap tren awal apabila keadaan berubah
- Berfungsi sebagai sokongan/rintangan dinamik
__________________________________________________________________________________________
LAGI PENUNJUK PERCUMA
Terokai pelbagai alat analisis pasaran—dari struktur dan volum hingga regresi, volatiliti, dan jangka masa tersuai.
Kod sumber tersedia di repositori GitHub.
Semua percuma untuk digunakan. Tetapi jika anda ingin menyokong dengan kopi, anda boleh salurkan ia di sini.
Sokongan/Rintangan
Volum
- Profiler Aktiviti Volum
- Penganalisis Kecekapan Volum
- Analitik Profil Volum
- Profil Volum - Dikemas kini
- Analisis Sebaran Volum
- VWAP (Harga Purata Berwajaran Volum)
Purata Bergerak
- Saluran SSL
- Purata Bergerak Berjangkar
- Purata Bergerak Skala Sisihan
- Pengaktif Tinggi Rendah Gann
- Garis Tren Segera
- Purata Bergerak Adaptif Kaufman dengan Visi Tren
- Saluran Purata Bergerak
- Suite Purata Bergerak
- Purata Bergerak Saluran Tren
Utiliti/Tersuai
Berasaskan Regresi
Volatiliti
Osilator
__________________________________________________________________________________________
PENAFIAN
Perdagangan melibatkan risiko. Penunjuk ini bertujuan untuk analisis teknikal sahaja — sentiasa gunakan pengurusan risiko yang betul dan berdagang dengan bertanggungjawab.
MAKLUMBALAS & PENAMBAHBAIKAN
Jika anda mempunyai cadangan, permintaan ciri, atau idea untuk penambahbaikan, sila tinggalkan komen di tab Perbincangan. Maklum balas anda membantu meningkatkan penunjuk untuk semua orang.
Ringkasan
Key features include a three-state color-coded visualization: green for strong uptrends, red for strong downtrends, and light blue for ranging or choppy markets, providing immediate visual insight into market states. Users can configure sensitivity parameters such as lookback period, fast and slow smoothing periods, and the ER threshold to tailor responsiveness.
The indicator automatically switches between fast and slow smoothing modes, adapting to changing market behavior. It also acts as a dynamic support and resistance tool, helping traders identify trend shifts early while filtering out noise in consolidation phases. This adaptive approach supports scalping and other trading strategies requiring both responsiveness and stability in directional and ranging markets.


