
Penerangan
Penunjuk Kedai Pinescriptlabs: 🤖Pinescriptlabs Kedai cBots :
ICT Power of 3 (cBot) Gold & BTC BreakoutSession Pivots(baru)YieldShield"
SmartTrend Sokongan &
Garis Rintangan
Struktur Pasaran Dinamik
Analisis Titik Pusing
Fibonacci Linear
Regresi Pelbagai Rangka Masa
Bias Lilin Pelbagai Tahap
Penjejak
Sokongan Auto dan
Garis Trend Rintangan
Semua Tahap Sokongan dan
Rintangan
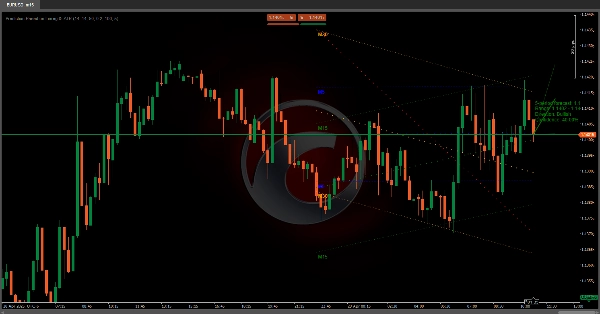
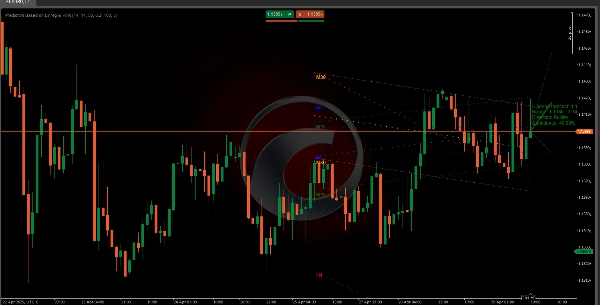
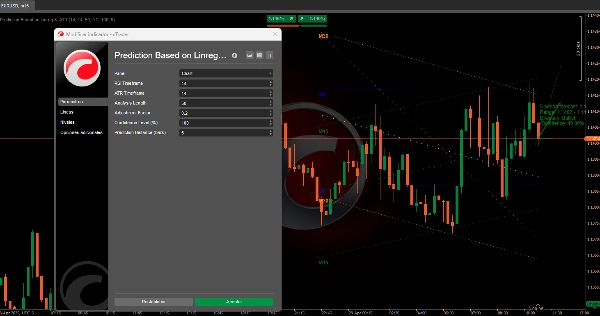
📈 Saluran Regresi Pelbagai Rangka Masa & Algoritma Ramalan ATR
Sistem ini meramalkan pergerakan harga potensi aset dengan menggabungkan analisis trend pelbagai rangka masa 📊, volatiliti pasaran 📉, dan pengesahan penunjuk teknikal ✅. Matlamatnya adalah untuk meramalkan julatan harga masa depan dengan keyakinan yang boleh diukur, sesuai untuk mengenal pasti peluang risiko-ganjaran berkemungkinan tinggi 💰.
🔧 Cara Kerjanya Langkah demi Langkah
1️⃣ Analisis Trend Pelbagai Rangka Masa
- Saluran Regresi Merentasi Rangka Masa:
Algoritma menganalisis serentak empat rangka masa berbeza (dari jangka pendek ke jangka panjang). Untuk setiap satu: -
- Mengira garis trend statistik berdasarkan tingkah laku harga sejarah.
- Menentukan saluran ramalan di sekitar garis ini (menggunakan volatiliti lalu untuk menetapkan had atas/bawah).
- Pengaruh Hierarki:
Rangka masa yang lebih pendek membawa berat lebih dalam arah akhir, mencerminkan kepekaan mereka terhadap pergerakan terkini.
2️⃣ Integrasi Volatiliti (ATR) 🌊
- Penyesuaian Volatiliti Dinamik:
Ramalan menyesuaikan dengan keadaan pasaran semasa: -
- Volatiliti tinggi → Unjuran lebih luas
- Volatiliti rendah → Penyesuaian konservatif
- Penskalahan Julat Masa Depan:
Jalur ramalan menyesuaikan secara automatik berdasarkan volatiliti yang dijangka.
3️⃣ Sistem Pengesahan Trend ✅
Menggabungkan empat isyarat utama untuk mengesahkan atau mencabar arah berdasarkan regresi:
- Persilangan Purata Pergerakan (pengesahan trend)
- Osilator Momentum (penilaian kekuatan)
- Penunjuk Volatiliti (pengesanan terlebih beli/terlebih jual)
- Analisis Divergensi (petunjuk pembalikan trend)
- Output: Satu sistem pemarkahan yang menguatkan atau mempersoalkan trend yang diramalkan.
4️⃣ Pengiraan Keyakinan 🎯
- Penyelarasan Rangka Masa:
Keyakinan meningkat apabila trend bersetuju merentasi rangka masa. - Ambang Ditentukan Pengguna:
Pedagang boleh menetapkan tahap keyakinan minimum untuk menapis hanya isyarat dengan kepastian tinggi.
5️⃣ Visualisasi Intuitif 📉📈
- Garis Ramalan:
Menunjukkan laluan jangkaan pusat (hijau = menaik 🟢, merah = menurun 🔴, kelabu = neutral ⚪). - Jalur Julat:
Menyorot zon pergerakan harga yang paling mungkin, disesuaikan mengikut volatiliti. - Label Maklumat:
Merumuskan harga yang dijangka, julat, arah, dan tahap keyakinan.
🌟 Kelebihan Utama
- Pendekatan Pelbagai Dimensi: Menggabungkan trend, volatiliti & momentum untuk mengurangkan isyarat palsu.
- Penyesuaian Sendiri: Menyesuaikan diri dengan pasaran yang tidak menentu atau trending secara automatik.
- Metik Telus: Keyakinan yang boleh diukur membantu mengurus jangkaan.
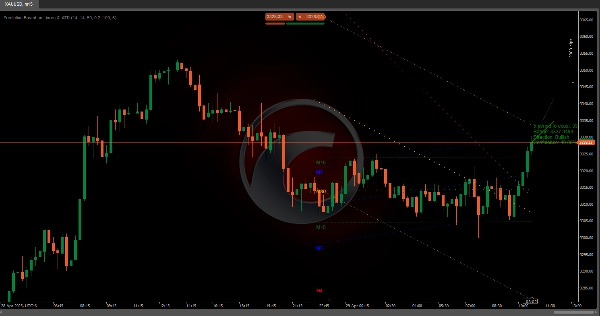
📌 Contoh Praktikal
Jika sistem mengesan:
- Trend menaik dalam rangka masa pendek + pengesahan momentum
- Volatiliti terkini rendah
- Persetujuan rangka masa yang kuat
→ Meramalkan kenaikan harga dengan jalur ketat dan keyakinan tinggi (contoh, 85%) 🚀
Ringkasan
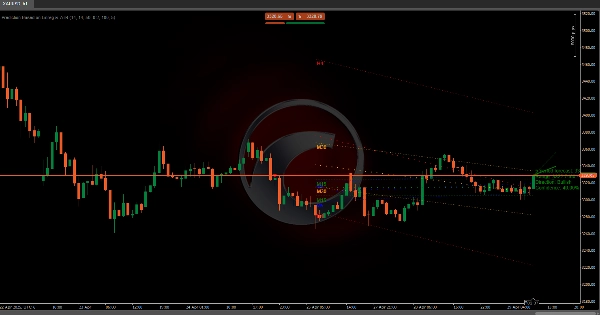
The ATR component dynamically adjusts the prediction bands to current market conditions, widening during high volatility and narrowing during low volatility periods. A trend confirmation system integrates four key signals—moving average crosses, momentum oscillators, volatility indicators, and divergence analysis—to validate or question the regression-based trend, producing a scoring system that indicates trend strength.
Confidence levels are calculated based on alignment of trends across timeframes, with user-configurable thresholds to filter signals by certainty. Visualization includes a central prediction line (color-coded for bullish, bearish, or neutral trends), range bands highlighting probable price zones, and an info label summarizing projected price, range, direction, and confidence.
The indicator supports markets including cryptocurrencies (e.g., BTCUSD), commodities (e.g., XAUUSD), and others. It aims to identify high-probability risk-reward opportunities by combining trend, volatility, and momentum analysis in a self-adjusting, transparent framework.


