
Opis
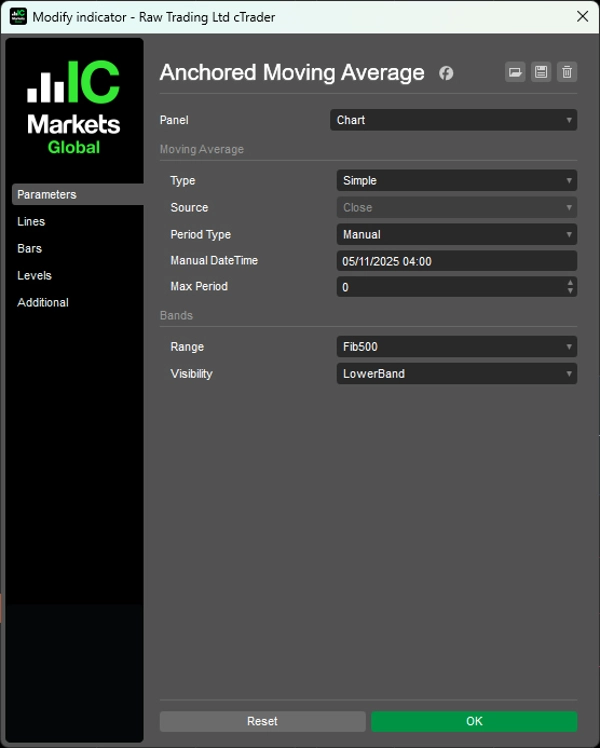
Zablokuj obliczanie średniej kroczącej na dowolnym momencie rynku i śledź zachowanie ceny w miarę jej przesuwania się do przodu.
Przypina obliczenia do wybranego punktu startowego (ręczna data i godzina lub okres wstecz od 1 godziny do 10 lat), a następnie rośnie naturalnie z adaptacyjnymi pasmami Fibonacciego opartymi na rzeczywistym zakresie cen.
Osiem poziomów Fibonacciego (od 11,4% do 100%), które dostosowują się do rzeczywistego ruchu cen, wbudowana strefa rewersji średniej 38,2%-62,8%, dwa typy MA (SMA/EMA), wiele trybów wyświetlania (pełne pasma, tylko granice ekstremalne, tylko strefa rewersji) oraz ogranicznik maksymalnego okresu dla długich ram czasowych zapewniają śledzenie momentum oparte na zdarzeniach dla traderów celujących w cofnięcia z istotnych punktów zwrotnych i analizę zachowania ceny po zdarzeniu.
CECHY
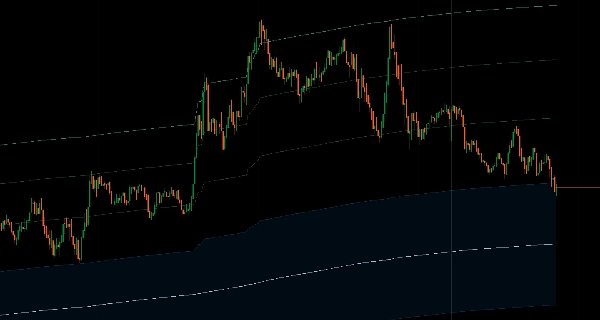
Obliczenia zakotwiczone w czasie
- W przeciwieństwie do standardowych MA używających stałych okresów, to rośnie naturalnie od wybranego punktu startowego
- Elastyczne kotwiczenie: ustaw ręczną datę i godzinę lub użyj predefiniowanych okresów wstecz (od 1 godziny do 10 lat)
- Śledź momentum od istotnych momentów rynkowych
- Spójne punkty kotwiczenia w różnych ramach czasowych
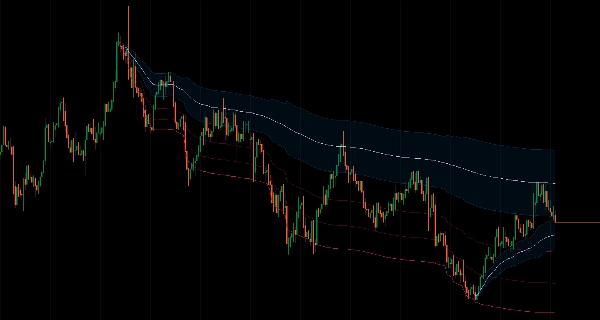
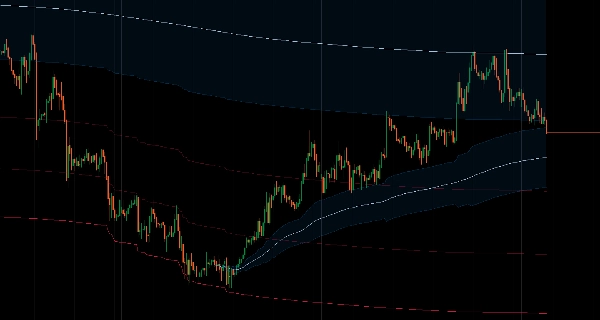
Adaptacyjne pasma Fibonacciego
- Automatycznie obliczane pasma oparte na rzeczywistym zakresie cen, a nie arbitralnych wielokrotnościach ATR
- 8 poziomów Fibonacciego (od 11,4% do 100%), które dostosowują się do rzeczywistego ruchu cen
- Strefy rewersji średniej: wbudowana strefa rewersji 38,2%-62,8% dla obszarów wejścia o wysokim prawdopodobieństwie
- Matematycznie zdefiniowane strefy prawdopodobieństwa
Dwa typy MA
- Prosta średnia krocząca
- Wykładnicza średnia krocząca
- Ogranicznik maksymalnego okresu: zapobiega nadmiernemu wygładzaniu na długich ramach czasowych
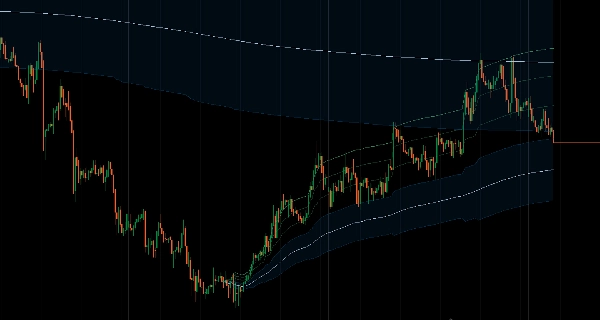
Wiele trybów wyświetlania
- Pełne pasma: widoczne wszystkie poziomy Fibonacciego
- Tylko górne/dolne: pokazuje granice ekstremalne
- Tylko strefa rewersji: skupienie na obszarze rewersji średniej
- Czysty, celowy design bez zbędnych elementów
Analiza oparta na zdarzeniach
- Zobacz, jak obecna cena odnosi się do ruchu z istotnych poziomów
- Śledź zachowanie ceny po zdarzeniu
- Wejścia oparte na strukturze z wyraźnymi punktami odniesienia
__________________________________________________________________________________________
WIĘCEJ DARMOWYCH WSKAŹNIKÓW
Odkryj szeroki zakres narzędzi analizy rynku — od struktury i wolumenu po regresję, zmienność i niestandardowe ramy czasowe.
Kod źródłowy jest dostępny w repozytorium GitHub repository.
Wszystko darmowe do użytku. Ale jeśli masz ochotę wysłać wsparcie na kawę, możesz to zrobić tutaj.
Wsparcie/Oporność
Wolumen
- Volume Activity Profiler
- Volume Efficiency Analyzer
- Volume Profile Analytics
- Volume Profile - Updated
- Volume Spread Analysis
- VWAP (Volume Weighted Average Price)
Średnie kroczące
- SSL Channel
- Anchored Moving Average
- Deviation-Scaled Moving Average
- Gann High Low Activator
- Instantaneous Trendline
- Kaufman Adaptive MA with Trend Vision
- Moving Average Channel
- Moving Averages Suite
- Trend Channel Moving Average
Narzędzia/niestandardowe
Oparte na regresji
Zmienność
Oscylatory
__________________________________________________________________________________________
ZASTRZEŻENIE
Handel wiąże się z ryzykiem. Ten wskaźnik jest przeznaczony wyłącznie do analizy technicznej — zawsze stosuj odpowiednie zarządzanie ryzykiem i handluj odpowiedzialnie.
OPINIE I ULEPSZENIA
Jeśli masz sugestie, prośby o funkcje lub pomysły na ulepszenia, zostaw komentarz na karcie Dyskusja. Twoja opinia pomaga ulepszyć wskaźnik dla wszystkich.
Podsumowanie
Opinie klientów
5 | 100 % | |
4 | 0 % | |
3 | 0 % | |
2 | 0 % | |
1 | 0 % |


![Logo „[CB] Pivot Points Pro”](https://cdn.ctrader.com/image/webp/43463c82-67b0-4f10-a4ba-901bba091d81_32594)


